Skip to content
The analysis of Postfix logs is crucial for quickly detecting malfunctions when sending emails, maintaining security and avoiding performance bottlenecks. In this article, I will show you how to practically analyze log files, understand typical entries and work efficiently with suitable tools such as pflogsumm, qshape or Graylog.
Key points
- Postfix logs contain all SMTP processes, delivery attempts and errors
- Typical log lines such as status=deferred give indications of problems
- grep and plogsumm facilitate the daily evaluation
- qshape Analyzes queues and detects bottlenecks
- Tools such as Graylog or Kibana enable Graphic processing of the statistics

Basics of Postfix logs: Structure, storage locations, log rotation
Postfix usually writes its logs in /var/log/mail.log or /var/log/maillogdepending on the distribution. In addition, rotated or specialized files such as mail.err, mail.warn or .gz archives exist for older data. These logs seamlessly record authentication attempts, email flows, deliveries and disconnections, among other things.
The rotation usually takes over logrotate. Older logs are compressed and archived. A standard configuration stores e-mail logs for four weeks. It is important to avoid unnecessarily large log files, as these delay the analysis. In order to analyze older data, I must first compress archives with zcat or zless unpack.
If the information in the log is not sufficient, the /etc/postfix/main.cf with parameters such as debug_peer_level or debug_peer_list activate a higher level of detail. Here I should choose from Data protection-However, you should carefully check whether personal data that needs to be protected appears in the logs.
Decrypt typical Postfix log entries
A log entry usually begins with a timestamp, followed by the host name, the responsible process (e.g. smtpd, cleanup, qmgr) and a unique queue ID. This is followed by the actual message. Each of these components helps to track individual incidents.
Relevant keywords in the log are, for example:
| Log part | Meaning |
|---|---|
| status=sent | Mail was successfully delivered |
| status=deferred | Delivery delayed, e.g. due to recipient unavailable |
| status=bounced | Message could not be delivered |
| connect/disconnect | Connection establishment or termination during SMTP exchange |
| authentication failed | Failed login attempt - possible security incident |
Such information provides direct information for support cases. Example: If a customer says, "My mail didn't arrive", I look for the Recipient address, Time or the Queue ID the relevant entry in the log.

Advanced strategies for log monitoring
Anyone who regularly has to process hundreds or even thousands of log lines a day often relies on a combination of automatic and manual evaluation in practice. In addition to classic tools such as grep or less a certain structure in log maintenance is recommended. For example, you can filter your logs so that you prioritize critical entries such as "authentication failed" or "bounced" immediately to the top. This makes it easier to recognize patterns in the event of failures or attacks.
Another strategy is to correlate the email logs in parallel with other relevant logs. For example, if a failure occurs at network level, the firewall could log conspicuous connection attempts at the same time. The combination of Mail server log, Firewall log and System log (e.g. /var/log/syslog) often provides the decisive clue in comprehensive setups as to where exactly the problem lies. Especially when debugging TLS problems or sporadic connection failures, this type of multiple analysis can significantly reduce the time required.
Manual analysis with shell commands
The command line is very suitable for quickly finding anomalies in the log file. With grep, less or awk I can find out specific information. Some useful examples:
grep -i "error" /var/log/mail.log: Shows errors in generalgrep -i "auth failed" /var/log/mail.log: Suspicious login attemptsgrep -i "to=" /var/log/mail.logDelivery to specific recipientgrep -E ": from=," /var/log/mail.logMessages from a specific domain
This is where I see the added value of targeted filters. Too many irrelevant entries waste time. If you regularly scan logs manually, you should set up a small Alias list in the .bashrc to have frequently used commands directly at hand.

Automated summary with pflogsumm
plogsumm is a classic Perl script that generates summarized reports from the Postfix logs. It analyzes sent and received mails, identifies errors and shows top senders and recipients as well as blocked hosts. A typical call:
/usr/sbin/pflogsumm --problems_first /var/log/mail.log.1 > /tmp/mailstatsI often integrate this into a script that is sent regularly via Cronjob and sends me a daily report by e-mail. This allows me to stay in control without having to look through logs manually every day.
Optimized log rotation and memory management
In very active mail server environments, several gigabytes of log data are quickly generated per week. Here it is important to Logrotate concept and consider how long you want to keep the logs. Additional parameters such as "rotate 7", "daily" or "weekly" to define whether logs are rotated daily or weekly and how many archive files should exist. If you want to save disk space, compress the older logs using commands such as "compress" or uses gzip. Importantly, these measures not only save memory, but also provide a better overview: small, digestible log files can be searched and analyzed much more quickly.
If a compliance framework such as the GDPR (General Data Protection Regulation) applies, additional deletion periods or restricted retention periods must be observed. Although we want to make troubleshooting easier, we do not want to store personal data for an excessively long period of time. Here it is advisable to logrotate-script to add automatic deletion routines after a certain time.
Detect bottlenecks in the mail queue with qshape
Mass emails to unreachable addresses or blocking recipient servers lead to backlogs in the mail server. The qshape-tool from Postfix helps me to make overloads visible:
qshape deferredThe output shows how many messages are in the respective aging segment, e.g. in the last 5, 10, 20 minutes, etc. This allows me to see at a glance whether a Backlog grows. Combined with grep and the queue ID, I can then precisely trace the cause of the problem in the log.
Integration in security monitoring solutions
Especially in larger companies or in systems with high security requirements, it is often necessary to have an extensive SIEM solution (Security Information and Event Management). Postfix logs are an important source of data for detecting potential attack attempts and anomalies at an early stage. For example, a SIEM tool can raise the alarm if there are a suspicious number of "authentication failed" attempts and automatically initiate countermeasures, such as temporarily blocking the corresponding IP address.
This approach is particularly interesting if you operate several Postfix systems in different locations. With a central SIEM platform, you can combine the log data from all instances and quickly identify patterns that extend across multiple locations. This makes coordinated intrusions or attacks with a wider spread visible more quickly. Manual analysis would be more laborious here, because without a central collection point you would have to look through all the logs individually.

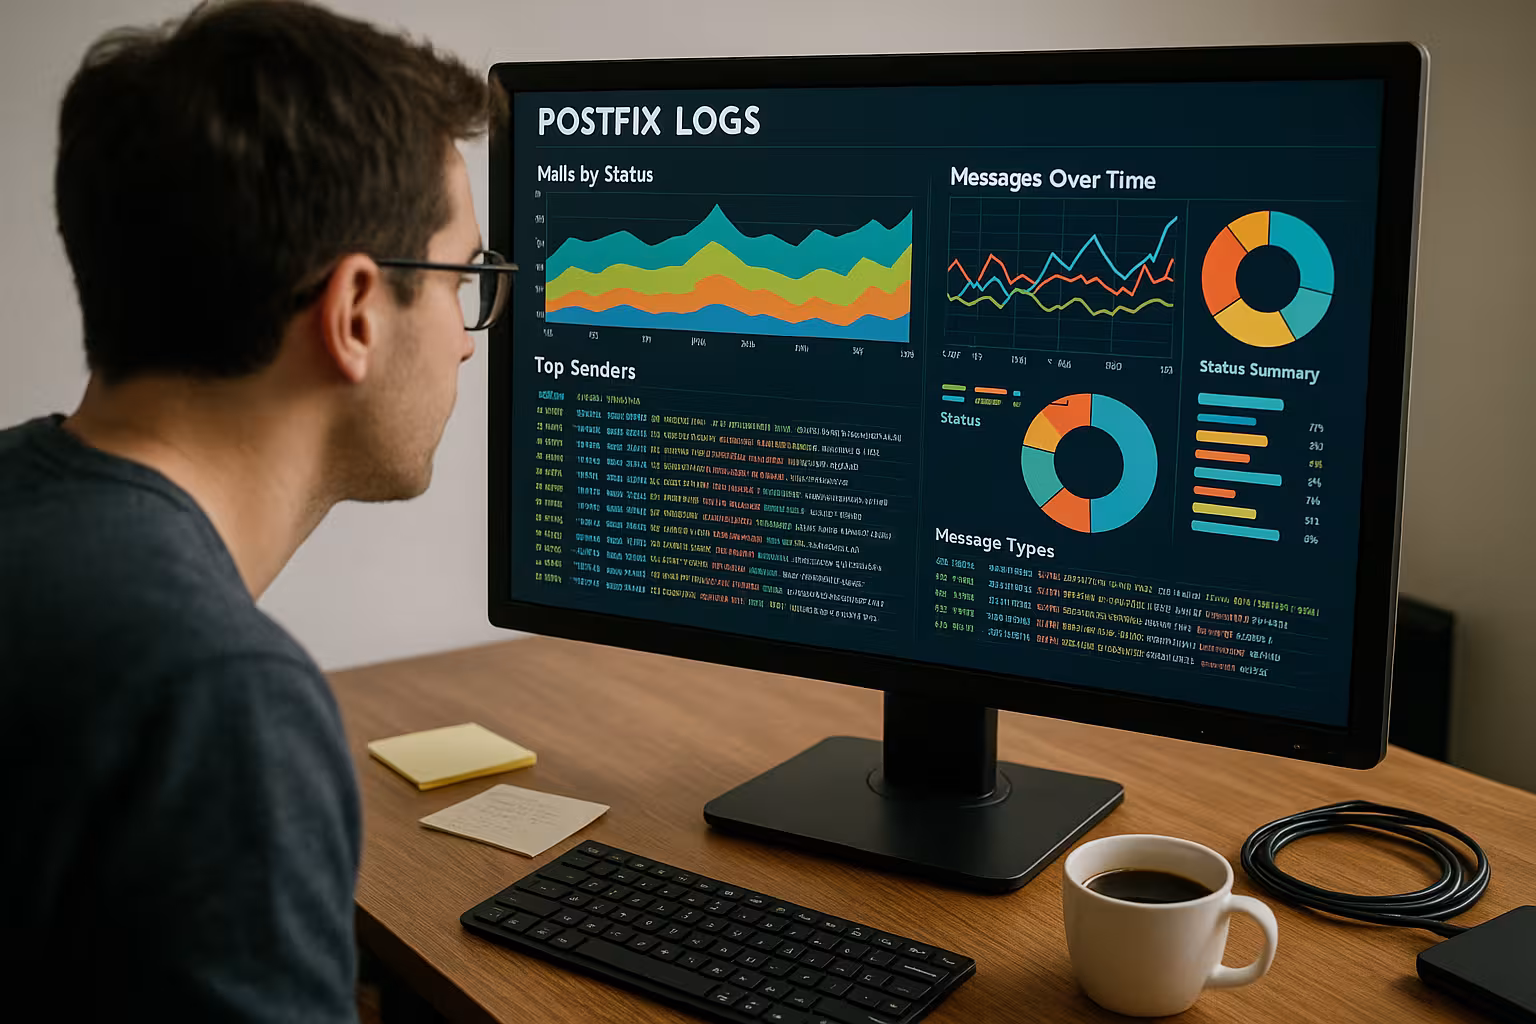
Professional visualization with external tools
For productive environments with many users, working with text files is inefficient in the long term. This is where tools such as Graylog, ELK Stack or Grafana excellent services. They collect log data centrally, index it and make it analyzable using graphical dashboards.
This data is usually read in via Logstash or Fluentd. I can then visualize top error sources, authentication attempts or connection problems in Kibana, including the time history. In very secure setups, the Use of Perfect Forward Secrecyto make the transport encryption more robust.
Extended security aspects for log analysis
An often underestimated challenge is the issue of security in relation to log analysis itself. The focus should not only be on the misconduct of botnets or rejected emails, but also on protecting your own log data. The logs often contain IP addresses, email addresses and metadata on senders and recipients. Anyone who logs too freely here or does not adequately protect backups can quickly come into conflict with data protection regulations.
It is also possible for attackers to deliberately try to manipulate log entries or "flood" the logs with extremely frequent false queries. This not only makes it more difficult to find real problems, but in the worst case can also push the log system to its performance limits. Early detection of such attacks and a robust logging setup are crucial for preventing manipulation or quickly initiating countermeasures.

Practical case: Mail delivery failed
When a user reports that their mail has not been received by a recipient, I start by searching for the time frame, recipient or sender in the log. I then evaluate the status with grep "status=" off. This is how I find out whether the condition sent, deferred or bounced reads.
Certain statuses such as "host not found" or "Connection timed out" clearly indicate DNS problems or blocked target servers. In such a case, it is worth taking a look at the correct Postfix setupto ensure that DNS resolvers or MX configurations are defined correctly.
Frequent tripping hazards in large environments
Especially in the hosting environment or in companies with several thousand email accounts, typical problems occur that are hardly noticed in small installations. For example, emails are often distributed across several internal systems, each of which generates its own logs. In this case, it can happen that central monitoring remains incomplete if only one of the servers involved is connected.
In addition, peak loads for large-volume advertising campaigns or newsletters are a frequent stumbling block. The Postfix system may try to send thousands of emails in a short space of time, which leads to queues forming. Consistent monitoring via qshape or an alarm that triggers when a certain deferred mail limit is exceeded can provide an early warning and enable measures to be taken - for example, the temporary limitation or staggering of large mailings.
Another problem area is the lack of coordination between Postfix and other services such as spam filters or virus scanners. If a virus scanner fails or works extremely slowly, this can be noticeable in an immensely growing queue. The correct log analysis then quickly shows the delays in the filter process, while Postfix is actually working normally. This interaction of several logs becomes more important in such cases.
Observe data protection and compliance
Log data contains potentially personal information, such as IP addresses or email addresses. It is therefore important to limit logging to what is technically necessary and to implement regular deletion concepts. This is configured in the main.cf or by Logrotate guidelines.
Unauthorized access to logs must also be avoided. Backup files or rotated archive contents belong Encrypted or at least secured by authorizations. Those who implement data protection precisely not only protect themselves, but also guarantee their users a high degree of reliability.
Typical sources of error and solutions
Delays are often caused by greylisting at the recipient or defective target servers. I usually identify such causes based on typical patterns with deferred-entries. For persistent errors, I check the queue with qshape and filter out suspicious domains.
In the event of authentication errors, incorrectly configured clients or automated bot attempts turn out to be the cause. Blocking via fail2ban or switching to secure protocols such as submission via port 587 with TLS - a topic that the Advanced Postfix configuration covers.
Continuous further development in e-mail operations
Postfix is an extremely flexible MTA system. Its log and analysis functions can be integrated into almost any workflow, be it with simple scripts, complex CI/CD pipelines or dedicated monitoring solutions. It is important that log data is not just understood as an archive, but as a lively source of informationwhich makes a decisive contribution to understanding the system.
For this to work, you should regularly check whether the selected level of detail in the logs still matches the current requirements. For example, if you are observing increasing problems with TLS connections, you can debug_peer_list to add affected hosts. Conversely, the debug level can be reduced if routine processes are stable and do not require increased monitoring. This keeps the data collection lean and avoids a confusing flood of entries.
At the same time, administrators and DevOps teams should always question whether the level of automation in the evaluation is sufficient. Reports and alerts can often be further refined in order to send the relevant messages to the mailbox or monitoring dashboard in a filtered form. If you invest the time to optimally automate the evaluation, you will often save it later when troubleshooting.