Skip to content
CPU cache hosting determines load time and TTFB in many real-world workloads because L1–L3 data is delivered directly to the core in nanoseconds, bypassing slow RAM access. I clearly show when cache size and hierarchy dominate computing time and why more RAM has little effect without a powerful cache.
Key points
- L1–L3 Buffers hot data closer to the core and significantly reduces latency.
- cache hierarchy beats RAM for dynamic queries and high parallelism.
- Cache per core counts for more than just RAM capacity with VPS/DEDI.
- Workloads WordPress, DB queries, and PHP benefit directly.
- Choice of tariff with CPU focus delivers noticeably faster responses.

Why CPU cache L1–L3 noticeably speeds up hosting
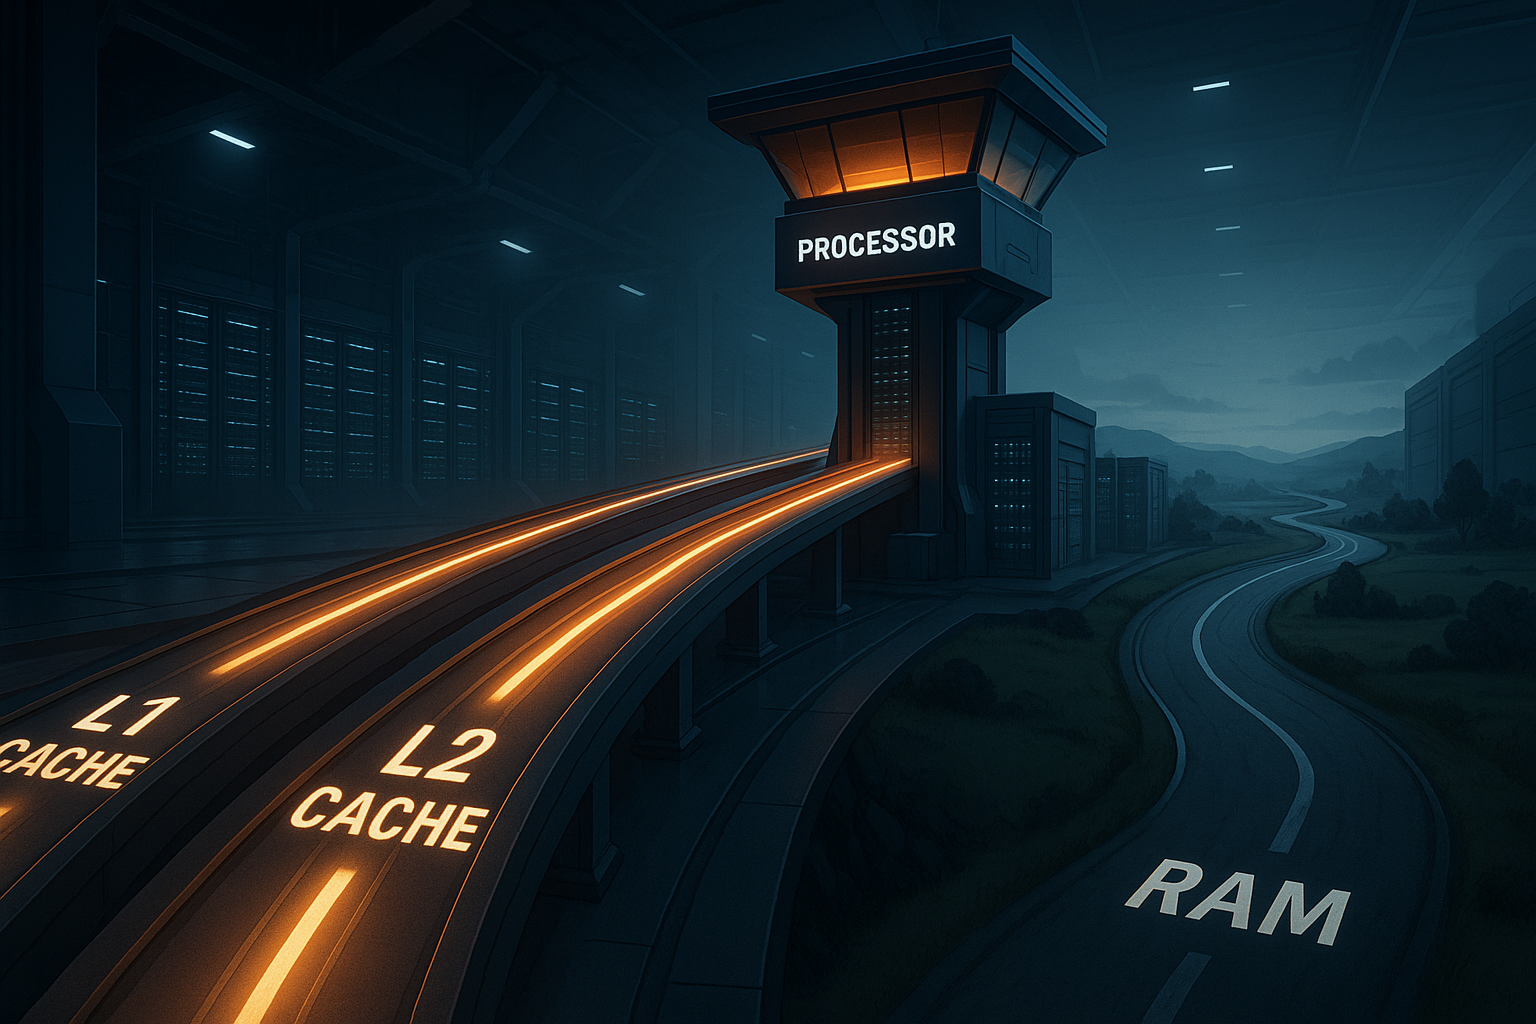
A Cache is located directly on the processor and delivers instructions and data without detouring via the motherboard. L1 is small but extremely fast; L2 expands the buffer; L3 holds a large amount of retrieval material for all cores. This allows the processor to avoid waiting times when accessing RAM These waiting times add up on web servers, as each request triggers multiple database and file system accesses. I repeatedly see in logs how short cache hits replace long RAM accesses, thereby reducing TTFB and CPU utilization.
How L1, L2, and L3 work together
The L1 cache delivers instructions and data in just a few clock cycles, which Latency to minimum values. If L1 misses, L2 serves the request with a little more time required. If L2 misses, L3 steps in, which is relatively large and keeps the hit rate high. Only when L3 misses does the CPU end up at the RAM, which slows down the cycle. I therefore plan hosting so that there is sufficient L3 is available because that is where many parallel web processes access shared data sets.

Cache vs. RAM: An overview of the figures
I summarize the typical sizes and relative speeds so that the Classification easier. The values vary depending on the CPU generation, but the ratios remain similar. L1 is very small and extremely fast, L2 is in the middle, and L3 is large and often shared between cores. RAM provides capacity, but higher access time and performs poorly with random access. It is precisely this random access that dominates web server stacks consisting of web servers, PHP, and databases.
| storage level | Typical size | Latency (relative) | Factor vs. RAM | Shared? |
|---|---|---|---|---|
| L1 (instructions/data) | 32–64 KB per core | extremely low | up to ~170× faster | no |
| L2 | 256 KB–1 MB per core | very low | significantly faster | no |
| L3 | up to 40 MB+, shared | low | up to ~15× faster | often yes |
| RAM (DDR) | GB area | high | Baseline | System-wide |
Cache architecture in detail: inclusive, exclusive, chiplets
Not all L3s are the same: some architectures run a inclusive L3 (holds copies of the L1/L2 lines), others rely on exclusive/mostly exclusive (L3 contains additional lines that are not in L1/L2). Inclusive increases coherence simplicity but costs effective space. Exclusive makes better use of capacity but requires smart victim management. In chiplet-based designs, L3 is often per bundled; requests that land on a different server incur extra latency. For hosting, this means: I try to, Workloads and their hot sets per day to bundle them so that the majority of accesses remain in the local L3. This reduces variance and stabilizes the 95th/99th percentile.
Real workloads: WordPress, databases, APIs
Dynamic pages start many small AccessesPHP fetches templates, MySQL delivers rows, and the web server reads files. If these patterns are found in the cache, the TTFB decreases immediately. WordPress demonstrates this very clearly, especially with CPU-bound themes and many plugins. If you dig deeper, you will find typical bottlenecks in CPU-bound WordPress described. I plan to use cores with a lot of L3 per core, because the query hot set and bytecode fragments remain in the buffer more often.
Practical values: The hotset of a medium-sized WordPress site is often in the single-digit megabyte range (Opcache bytecode, autoloader maps, frequent DB indexes). E-commerce shops bring additional price and stock indexes as well as session data into play. If this bundle fits into L3, the ups and downs in response time are significantly reduced—even without changes to the application or RAM size.
Cores, threads, and cache per core
Many cores only help if there is enough per core. Cache otherwise threads compete more intensely. Hyper-threading does not double the computing power, but shares the cache structure. With more L3 per core, utilization remains stable and the variance in response times small. Multitenant VPSs benefit in particular because hotsets from multiple sites remain in the shared L3. I therefore pay attention to the ratio of cores to L3 capacity, not just the pure core counter.
A common misconception: “More threads = more throughput.” In practice, conflict misses and context switching increase. I limit workers precisely so that IPC (Instructions per Cycle) remains high and the miss rates do not run away. This often delivers better percentiles in load tests than a “maximum parallelism” approach.
NUMA, memory access, and latency traps
Modern servers often use multiple NUMA-nodes, which can lengthen paths in memory. Distributing processes across nodes increases latency and reduces cache hits. I prefer to bind services so that hotsets remain local. A brief overview of NUMA architecture shows how important proximity between the core, cache, and RAM bank is. With good placement, requests secure more cache hit and less expensive trips to distant memory.
Important: Cross-NUMA traffic This isn't just a RAM issue. L3 coherence across nodes also increases latency. That's why I test under load which NUMA node the active database and PHP FPM pools are located on, and keep web and DB processes in the same topology as far as possible. This prevents sessions, query plans, and bytecode from constantly being pushed “across the street.”.

I/O waits for the CPU: Why RAM is rarely the bottleneck
RAM capacity helps with the file system cache, but most of it waiting time occurs in the application's code path. These paths benefit from fast instruction and data caches, not from more gigabytes. With random accesses, RAM bandwidth quickly evaporates, while a large L3 cushions the jumps. I measure in profilers that cache miss rates correlate closely with TTFB and 95th percentile. That's why I weight CPU cache higher than pure RAM size, until the failure rate decreases.
SSDs also “appear” faster when the CPU waits less. Fewer context switches and shorter code paths mean that I/O completion is processed faster. Caches are the catalyst here: they keep the hot instruction paths warm and minimize stalls, while the scheduler has to move fewer threads back and forth.
Understanding cache miss types and reducing them in a targeted manner
In practice, I distinguish between four causes:
- Compulsory misses (cold): Initial access to new data; can be reduced by warm-up strategies (preloading the most frequent routes, warmer for Opcache).
- Capacity ShortfallsHotset does not fit completely into Lx; I reduce the size by using smaller code paths, fewer plugins, and optimized indexes.
- Conflict MissesToo many lines map to the same sets; better data locality and reduced dispersion help, as do “smoother” data structures.
- Coherence MissesShared data is often written; I minimize global mutables and use local caches (APCu) to reduce write traffic.
At the application level, this means reducing random accesses (e.g., less scatter-gather in PHP), combining queries, keeping object caches consistent, and ensuring that hot code is not constantly recompiled or reloaded.
Practical purchase criteria for hosting plans
For VPS and dedicated servers, I first check the CPUgeneration, then cache size per core. A tariff with less RAM but strong L3 per core often beats a model with a lot of RAM and weak cache. Clock speed under load, turbo behavior, and how the provider allocates cores are also important. For shops with many simultaneous requests, L3 capacity pays off disproportionately. Those who already use caches in apps, DBs, and CDNs will also benefit from a Cache-strong CPU, because hotsets hit more often.
I am explicitly asking: How many vCPUs per physical core Does the provider share? Are vCPUs mixed across NUMA boundaries? Are there guarantees that vCPUs are located within the same die? Such details determine whether L3 acts as an accelerator or is affected by noisy neighbors. diluted will.
Tuning: Software makes better use of the cache
I maintain PHP-Opcache, JIT settings, and DB buffer so that hot paths in L3 fit and recompiles are rare. Overly strict thread pinning inhibits scheduler optimizations; why this often has little effect is shown by CPU pinning. Instead, I limit workers so that they don't displace the cache. I ensure short code paths, fewer branches, and warm bytecode caches. This reduces miss rates, and the processor spends more time with useful work instead of waiting.
Deliver in PHP stacks OPcache memory and interned strings significantly better location. In addition, I am focusing on a local APCu for read-heavy data and a persistent object cache (e.g., Redis) with a manageable number of keys so that hot keys remain in L3. In the database, I reduce secondary indexes to the bare minimum and optimize the sort order so that sequences are created instead of jump patterns.
Metrics: What I monitor
I constantly observe Miss Rates (L1/L2/L3), IPC (Instructions per Cycle), and clock speed under load. I also check TTFB, 95th/99th percentile, and error logs during load changes. These metrics show whether the code path fits into the cache or slips away. I correlate miss peaks with deployments, traffic peaks, and new plugins. This allows me to quickly find the places where more cache hit bring the greatest benefit.
For ad hoc analyses, I watch live on “perfect stat”Metrics such as cycles, instructions, branches, branch misses, and LLC misses. I consistently use recordings, the frequency under load (turbostat) and context switches per second. When IPC drops under pressure and LLC misses increase at the same time, the bottleneck is almost always cache capacity or data locality—not RAM throughput.
Benchmarking and test setup: measuring realistic responses
I'm testing with representative routes instead of just static files. A mix of home page, product details, search, and checkout covers different code paths. With graduated load levels (cold, warm, hot), I can see how quickly the cache fills up and where it tips over. The important thing is the steady-state phase, in which the frequency, IPC, and miss rate run stably. Only then can I fairly compare speeds and CPU generations.
Measurable signals:
- Median TTFB drops significantly after warm-up and remains low → Caches are effective.
- 95th/99th percentile drifts only slightly at peak load → sufficient L3 per core.
- IPC increases with fewer workers → Conflicts and mistakes decrease.
- LLC misses correlate with new plugins/features → Hotset enlarged.
For each test, I document the active CPU frequency, number of workers, route mix, and, if applicable, NUMA placement. This allows optimizations to be clearly assigned and reproduced.
Virtualization and multitenancy: Sharing cache without losing it
In VPS environments, clients share the same physical L3. If a guest's vCPUs are distributed widely across the machine, loses Good providers bundle a guest's vCPUs on the same CCX/CCD/tile. I see this in more stable percentiles and lower variance. In addition, I limit workers so that my own stack does not flood the L3 and conflict with neighbors.
Containers on the same host compete in a similar way. A lean base container with preheated Opcache and as little dynamic autoloading as possible keeps L3 clean. I avoid aggressive sidecars on the same node that produce high instruction areas (e.g., “log everything, everywhere”). This belongs on a separate node or outside the hot path CPU.
Prefetcher, TLB, and page sizes: hidden levers
Modern CPUs have prefetcher, who prefer linear patterns. The more sequential the code and data are arranged, the more beneficial it is. I therefore prefer structured arrays and more compact structures to hash-heavy and highly branched layouts. I also pay attention to the TLB (Translation Lookaside Buffer): Many page walks are expensive and drag L1/L2 along with them. Huge pages can help cover bytecode and DB hotsets with fewer TLB entries. In InnoDB and JIT configurations, I therefore check whether larger pages bring measurable benefits—always with A/B measurement, because not every stack benefits equally.
Practical checklist: fast cache hosting in 10 steps
- CPU generation and L3 per core Check not only the core count and RAM.
- Check vCPU allocation: bundling per Die/NUMA instead of dispersion.
- Limit workers to IPC sweet spot; minimize percentile variance.
- Dimension PHP Opcache generously but purposefully; avoid recompiling.
- Use persistent object caches, keep the key space lean.
- Tailor DB indexes to hot queries; reduce random accesses.
- Ensure NUMA locality: Web, PHP, DB in the same node where possible.
- Prefetcher-friendly data paths: sequential, fewer jumps.
- Provide deployments with warm-up; intercept cold misses before traffic peaks.
- Monitoring: Continuously correlate IPC, L1/L2/L3 miss rate, clock speed, 95th/99th percentile.
Briefly summarized
In hosting, a strong CPU cache L1–L3 every dynamic request, while additional RAM primarily provides capacity. I therefore prioritize cache size per core, clean process placement, and appropriate worker numbers. In Tools, I see that fewer misses result in measurably better response times and stable percentiles. When selecting tariffs, you should pay attention to cache specifications and CPU generation, not just GB specifications. This allows you to get more out of the same software. Performance out—without any expensive hardware upgrades.