Skip to content
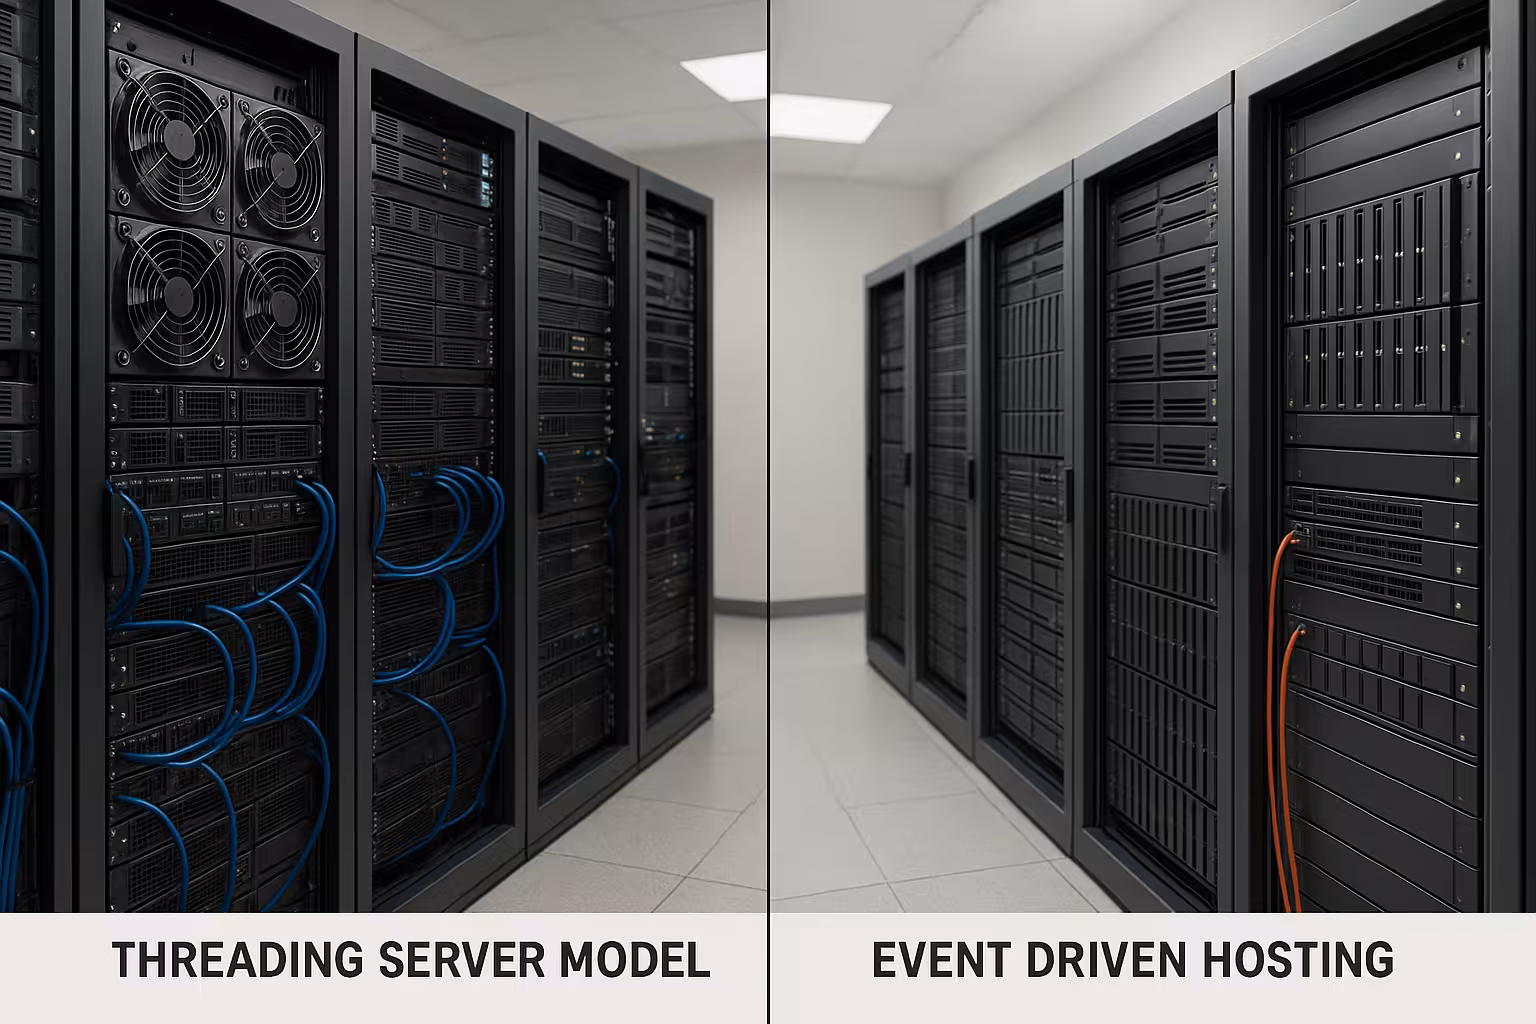
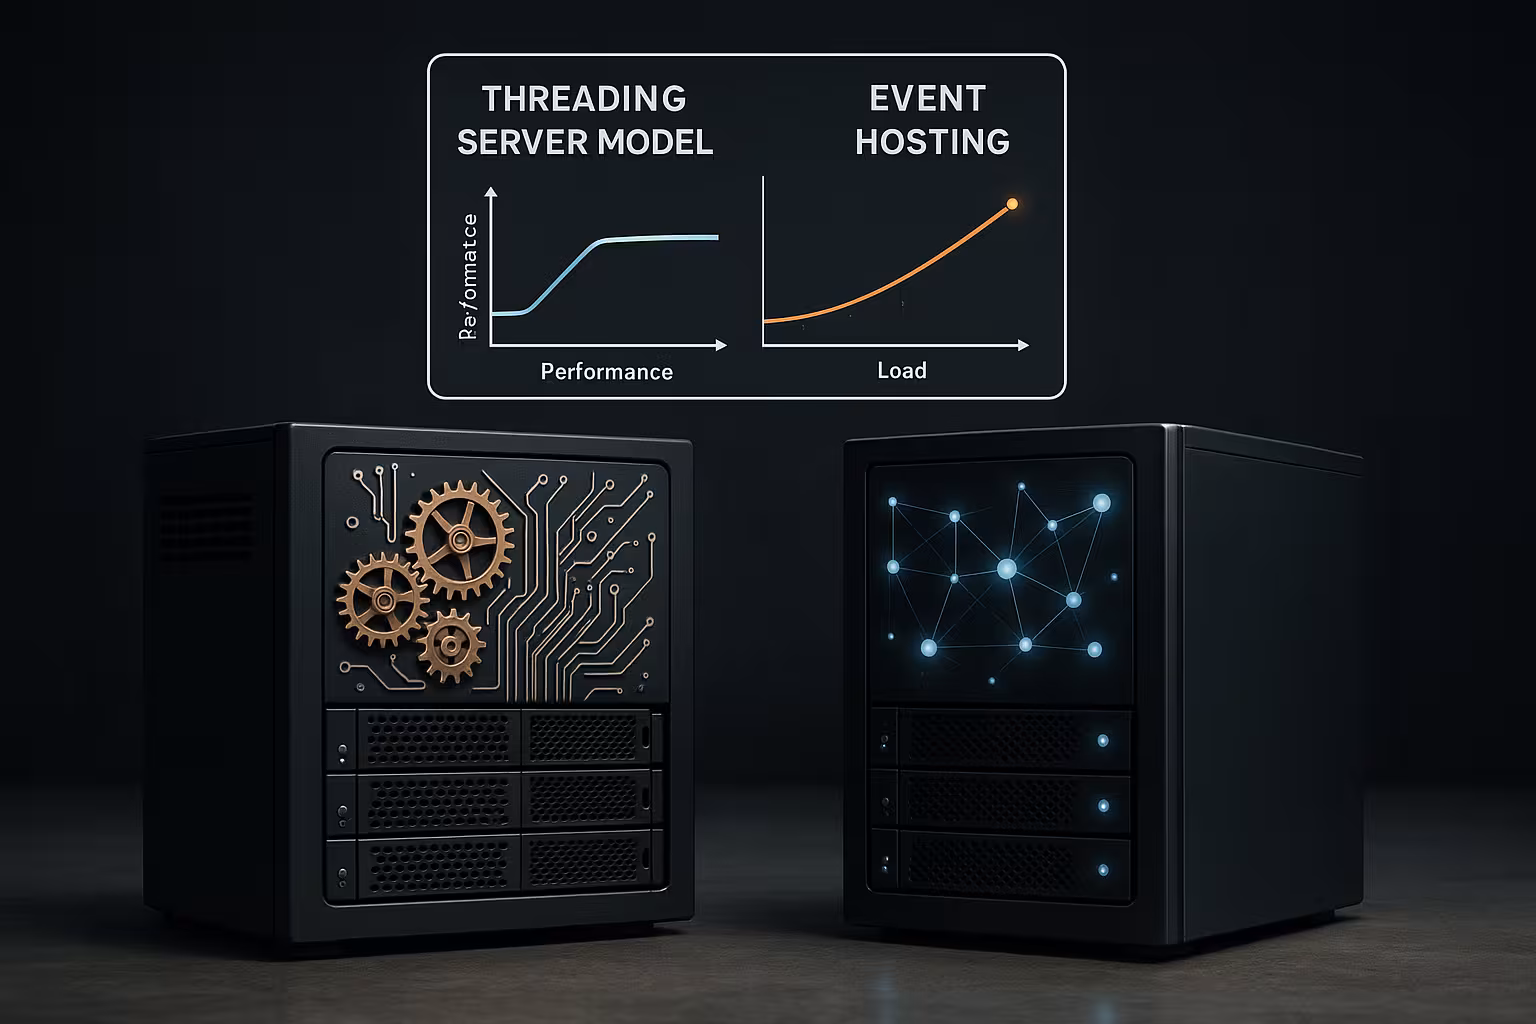
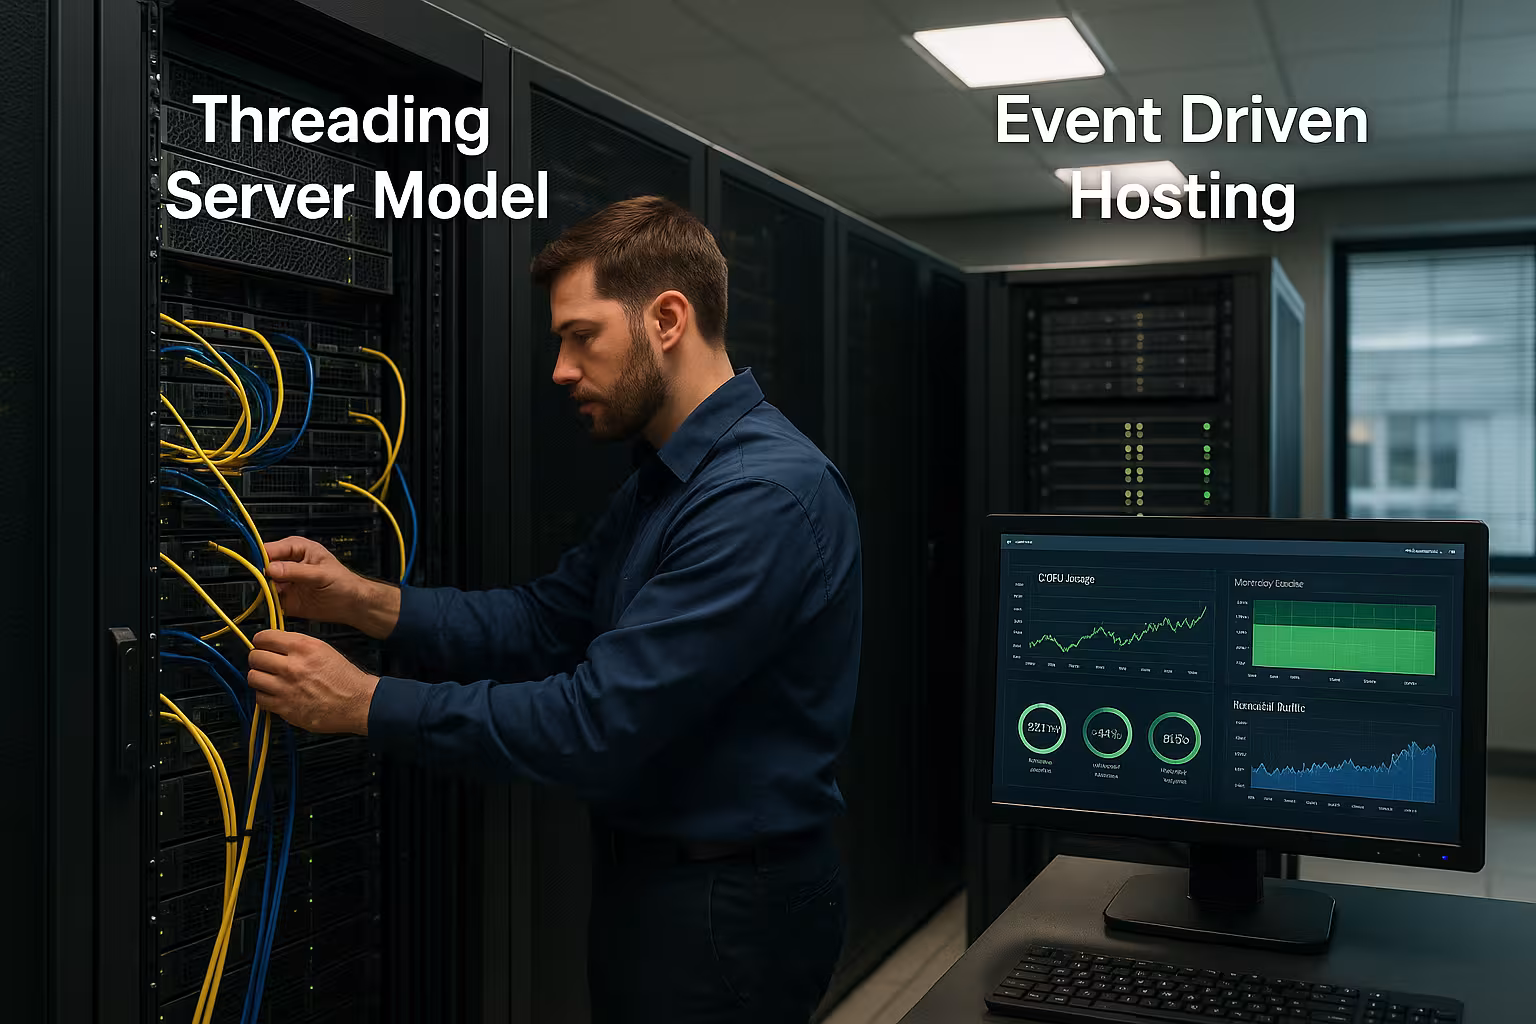
The threading server model creates threads or processes per connection, while Event-Driven hosting with an asynchronous event loop handles thousands of requests in parallel. I compare the Performance of both architectures based on latency, CPU load, memory requirements and real workloads so that you can make an informed decision on what suits your traffic and application profile.
Key points
Before I delve deeper, I'll summarize the most important findings in a compact format so that you can quickly grasp the common thread. I will highlight performance, scaling, resources and practice, because each architecture has its own strengths. I deliberately keep the language clear so that beginners can follow along quickly and professionals can categorize the key figures directly. The following key points mark the focal points that I return to again and again in the text. This will help you find the section that best suits your Questions answered and your Priorities addressed.
- ScalingThreads per connection vs. event loop with few workers
- Latency: Fewer context switches reduce response times
- ResourcesRAM overhead with threads vs. lean state machines
- CachingHTTP/3, opcode and object cache push Event-Driven
- Choice of practiceLegacy with blocking I/O vs. high-traffic CMS and APIs
How the models work
In the classic model, I assign a separate thread or process to each incoming connection, which in Apache is done via the MPM variants prefork, worker and event; details are summarized under MPM models explained together. This allocation isolates connections well and makes blocking I/O manageable, but each thread has its own stack memory and scheduling overhead, which noticeably drains RAM and CPU when there is a high degree of parallelism. The Event-Driven counterpart dispenses with threads per client and relies on non-blocking sockets plus an event loop that efficiently distributes events such as „data received“ or „socket writable“. NGINX and LiteSpeed serve as role models here: One worker manages thousands of connections in parallel, reduces context switches and keeps states as compact State-machines. As a result, the architecture remains more lightweight and reacts more consistently under load, especially with many simultaneous short-lived requests [3][5][8].
Resource consumption and latency
Each thread requires its own stack memory, typically 1-8 MB, and triggers context switches, which with 10,000 parallel connections quickly slips into the double-digit gigabyte range and increases the CPU-times for scheduling. In tests, Apache setups end up with around 1,500 concurrent requests, 210 ms response time and 85 % CPU load, which shows the practical upper limit under common configurations [5]. An event loop maintains the same throughput with significantly less RAM because there is no thread flood and hardly any scheduler work; NGINX achieves over 4,000 requests at 130 ms and 55 % CPU [5]. LiteSpeed goes one better by using integrated caching and HTTP/3 to reduce the TTFB; 10,000+ requests at 50 ms and 20 % CPU show how much overhead can be eliminated [5][8]. I consider these differences to be structural: Less Context change, non-blocking I/O and efficient event distribution are directly reflected in latency and energy consumption [3].

Direct performance comparison in figures
I compare the core data in table format so that differences in latency, parallel connections and CPU usage are clearly visible at a glance. The column on architecture anchors the respective design principles from which the measurement results follow. If you want to speed up CMS such as WordPress, event-driven stacks offer a clear advantage, which I explain separately in my overview of LiteSpeed vs NGINX illuminate. I use these values to plan capacities more realistically because reserves and bottlenecks can be identified early on. The figures originate from laboratory and practical observations and cover typical Configurations of today's hosting setups [3][5][8].
| Web server | Architecture | Parallel requests | Response Time | CPU usage |
|---|---|---|---|---|
| Apache | Multi-thread | 1.500+ | 210 ms | 85 % |
| NGINX | Event-Driven | 4.000+ | 130 ms | 55 % |
| LiteSpeed | Event-Driven | 10.000+ | 50 ms | 20 % |
Workload types and application scenarios
For I/O-heavy workloads such as static files, reverse proxy tasks, HTTP/2 and HTTP/3 multiplexing or PHP-based CMS, an event loop with non-blocking I/O provides noticeable advantages because it reduces idle times and keeps TTFB short [3][5]. WordPress or WooCommerce stacks benefit, as caches land hits more frequently and the server has less Overhead per request, which supports core web vitals and stabilizes search engine signals [5]. For legacy applications with long-running blocking tasks that cannot be easily asynchronized, I often choose Apache worker or prefork, because process or thread isolation mitigates the risks of blocking operations. APIs with high throughput and many concurrent connections play to their strengths under event-driven conditions, especially when keep-alive connections are long-lived. It is crucial that I measure the load profile honestly and derive the architecture from this, instead of making a blanket assumption based on a known Sample to set.
Protocols and connection patterns
HTTP/1.1 quickly relies on a large number of simultaneous connections for many small objects; threads or processes per connection scale worse here. HTTP/2 bundles streams via a TCP connection and thus reduces connection overhead, but suffers from TCP head-of-line effects in the event of packet loss. A Event loop can serve the multiplexed streams more efficiently because a few workers monitor the I/O readiness of many sockets [3][5]. HTTP/3 (QUIC) eliminates TCP congestion on packet loss links and keeps TTFB more constant over mobile or WLAN links; the benefit is often greater in real networks than in the lab [5][8]. Event-driven is predestined for WebSockets, server-sent events or gRPC - i.e. long-lived, bidirectional paths - because only a few bytes of status information are stored in the working memory per connection and hardly any scheduler work is required. In the threading model, on the other hand, each long-lived connection is permanently „occupied“ with stack memory, which reduces capacity.
CPU and platform selection
I pay attention to high clock frequencies for heavily single-threaded components, such as PHP interpreters or certain database paths, because fast cores reduce the P99 latency [1]. A larger L3 cache reduces RAM accesses during multitenancy and thus indirectly affects the Response-Stability; event-driven servers benefit from this because a few workers manage many connections. In NUMA setups, I bind workers to nodes to avoid cross-node latencies and cache misses, which is especially important under heavy connection loads [1][7]. ARM-based servers provide an energy-efficient alternative, especially for workloads with many parallel I/O events that do not require extreme single-core peaks [9]. I plan sufficient reserves for both architectures so that load peaks do not result in Throttle-tipping the scales.
Architecture units in the event loop
Most high-performance servers combine reactor patterns (epoll/kqueue) with lean state machines per connection. I keep the number of workers per NUMA node small (often 1-2 per socket) and scale via worker_connections, so that the kernel sees fewer context switches [1][7]. I outsource long-running, CPU-heavy tasks to dedicated process or thread pools so as not to block the event loop; this ensures low P95/P99 values [3]. Zero-copy sendfile and TLS session resumption reduce copy and crypto overhead; with HTTP/3 it is worth checking the packet-pacing options so that QUIC streams share bandwidth fairly [5][8]. This setup explains why event-driven stacks under identical hardware carry more concurrent clients with more stable latencies.
Resource consumption and latency
Opcode caches such as OPcache reduce the load on PHP, while Redis or Memcached accelerate frequent object accesses and thus save database IOPS [2][6]. Event-driven stacks benefit disproportionately from this because they convert ultra-short wait times in the event loop directly into lower TTFB; LiteSpeed reinforces this with integrated cache and HTTP/3 [5][8]. I also consider a front-side HTTP cache so that hot content is delivered from RAM and dynamic paths feel less pressure. It remains important to clearly define cache invalidation so that updates appear reliable and no outdated properties get stuck. With a coherent caching concept, the server load is halved in many setups, which frees up capacity for growth phases [2][6].
Edge caching and revalidation
I combine microcaching (0.5-5 s) on hot routes with headers such as ETag, Cache-Control and „stale-while-revalidate“ to cushion load peaks without losing consistency. At application level, I reduce cache buses with precise keys (e.g. user role, language, currency) and avoid unnecessary Vary dimensions. Collapsed forwarding prevents origin stampedes if many clients request the same expired content at the same time. Under HTTP/3, these measures have an even stronger effect, as connection establishment and loss tolerance reduce latency peaks; the event loop converts the free Time window directly into more usable capacity [5][8]. In threading environments, I plan more conservatively because the per-thread costs remain noticeable even with cache hits.

Tuning for multi-threaded environments
I set upper limits for threads per process so that there is no thread explosion under load, which ties up RAM and CPU schedulers [7]. I keep keep-alive moderate to conserve resources per connection and define hard timeouts so that faulty clients do not block any slots. At system level, I minimize context switches through clean CPU affinity, set priorities for network interrupts close to the affected cores and check whether SMT has any disadvantages in the event of a heavy neighbor load. For Apache, I adapt the MPM parameters to the profile and target latencies; you can find more detailed information in my compact Thread pool optimization. In addition, I provide monitoring with meaningful Metrics such as P95/P99 latency, occupied stack memory and error classes, so that I can quickly recognize deviations.
Fine-tuning for event-driven stacks
I bind workers to NUMA nodes, optimize the number of workers per physical core and pay attention to epoll/kqueue parameters to keep queues short [1][7]. I activate HTTP/3 if the client base and CDN chain support it, because the gain in lossy links and mobile connections stabilizes the TTFB [5]. I set file descriptor limits, socket buffers and kernel TCP stacks generously so that many simultaneous connections do not run into artificial ceilings. LiteSpeed also benefits from fine-grained cache rules and smart ESI, while NGINX scores with microcaching on hot routes; I measure the impact on live traffic before scaling globally [5][8]. With clean logging at event level, I find bottlenecks in the event-loop without exploding debug overhead.
Security, isolation and multi-tenancy
In shared environments, I rely on process and namespace isolation, cgroups and restrictive file system jails to contain „noisy neighbor“ effects. Threading servers offer a natural separation of processes and Insulation, event-driven servers compensate for this with strict limits per worker (FDs, rate limits, request body max) and clean backpressure [3][7]. Aggressive header/body timeouts and minimal accept-backlogs; under HTTP/2/3 I add connection and stream limits as well as priority rules. I clearly differentiate between 429 (rate limit) and 503 (overload) so that upstreams and CDNs react correctly. Security scans and WAF rules must be protocol-sensitive so that HTTP/2/3-specific edge cases such as request prioritization or stream resets are handled correctly [5].
Observability and troubleshooting
I instrument each stack with metrics along the chain: accept queue length, active connections, event loop delay, queue times to upstreams, TLS handshakes per second and error classes (4xx/5xx) [1][3]. P95/P99 broken down by „Time to First Byte“ and „Response Complete“ shows whether the network, app or storage are limiting. eBPF-based traces uncover kernel hotspots such as epoll_wait, TCP retransmits or memory allocations without significantly slowing down. In threading environments, I also monitor stack utilization and context switch rate; in event-driven setups, I pay attention to blockers in the loop (e.g. sync file I/O) and buffers that are too small. Correlation is important: log lines with connection ID or trace ID connect the web, app and DB view and speed up root cause analysis [7].

Costs, energy and sustainability
I look at CPU watts per request because this key figure shows how efficiently an architecture uses power; event-driven servers usually perform better here [3][9]. Fewer context switches and a lower memory load often mean noticeable savings over the year, especially as cooling systems have to work less. In shared or managed environments, I scale more efficiently because the same Hardware more parallel connections and peaks land on hard limits less frequently. Investments in NVMe SSDs with a high IOPS rate are particularly worthwhile for DB-heavy workloads, as queues on the storage front quickly slow things down [2][6]. This not only reduces costs in euros, but also increases availability during traffic peaks that occur in campaign phases or seasons.
Backpressure, queues and tail latency
I plan capacity using Little's Law: L = λ - W. If the waiting time W increases at a fixed service rate, the number of simultaneously waiting requests L increases - the noticeable congestion. Event-driven servers can cope with higher L before the P99 latency drops because they operate with very little overhead per connection [3][5]. Early signaling of backpressure is critical: it is better to send 429/503 quickly with retry after than to jam requests for minutes. Queue budgets per layer (ingress, web, app, DB) prevent a downstream bottleneck from overflowing the frontend server. Threading setups must strictly cap the number of threads, otherwise the scheduler will eat up the CPU time; event-driven stacks need hard async limits so that blocking paths do not freeze the loop [7]. With clear SLOs (e.g. 99% < 200 ms) I actively control against tail latency instead of optimizing mean values.
Load tests, scenarios and methodology
I test with both „closed loop“ (fixed concurrency) and „open loop“ (fixed RPS), as both make different bottlenecks visible. Warm-up phases are mandatory: caches, JIT/opcode and kernel buffers must fill up, otherwise cold starts are deceptive [1][3]. I vary paylads, keep-alive duration, HTTP/2/3 shares and simulate packet loss and RTT to simulate mobile reality. Measured variables are throughput, P50/P95/P99, error rates, CPU time in user/kernel mode, context switches, FD usage and upstream latencies. Important: Tests against real applications, not just static files, because PHP/DB paths often dominate. I also check accept/SYN backlogs and kernel TCP settings (buffers, retries) so that I do not measure any artificial ceilings [7]. The profiles obtained then feed solid capacity and cost engineering [3].
Migration and compatibility in practice
When switching from Apache to NGINX or LiteSpeed, I pay attention to functional parity: .htaccess rules, dynamic rewrites and directory semantics must be migrated cleanly. I set PHP-FPM or LSAPI parameters (max_children, process management) to match the concurrency target so that the web server does not starve on the upstream. I often start hybrid: Apache remains internally responsible for legacy routes, an event-driven proxy terminates TLS/HTTP/2/3 and serves static content and new APIs. This reduces risk and allows me to shift the load in a targeted manner. Monitoring during the migration is mandatory in order to detect regressions in TTFB, error rates or cache hit rates at an early stage [5][8]. Finally, I clean up configurations, remove unused modules and document limits (timeouts, body size, rate limits) so that operation remains reproducible.
Decision support according to project phase
In early project phases with uncertain traffic, I prefer to start with event-driven hosting because the architecture buffers load jumps better and module replacement is easier [3][5]. If the proportion of long-running blocking operations increases, I specifically check hybrid approaches or separate these paths on a multi-threaded server to keep the fast path clean. For WordPress, WooCommerce, headless CMS and APIs with many parallel clients, I clearly recommend the event loop approach, as latency and throughput remain more constant [5][8]. Legacy applications with special Insulation and known blocking patterns often run safer under Apache worker or prefork, as long as RAM budgets bear the thread costs. Before going live, I test each option under real load to balance P95/P99 targets against budget and power consumption and mitigate bottlenecks early [1][3].
Briefly summarized
The threading server paradigm provides simple isolation and handles blocking I/O well, but pays for the convenience with RAM overhead and more context switches that slow down the Latency to the top. The event-driven design holds thousands of connections with just a few workers and scores points for latency, CPU load and energy efficiency, especially in caching-heavy web stacks [3][5][8]. For CMS, APIs and proxies, I clearly recommend the event loop, while for legacy with hard blocking I choose parts of the multi-threaded approach. Hardware selection, NUMA binding, HTTP/3 and consistent caching move the bar noticeably, regardless of the architecture [1][2][6][7][9]. If you collect measured values, visualize bottlenecks and trim them in a targeted manner, you can make reliable decisions and manage to achieve the following over longer periods of time Reserves for growth.