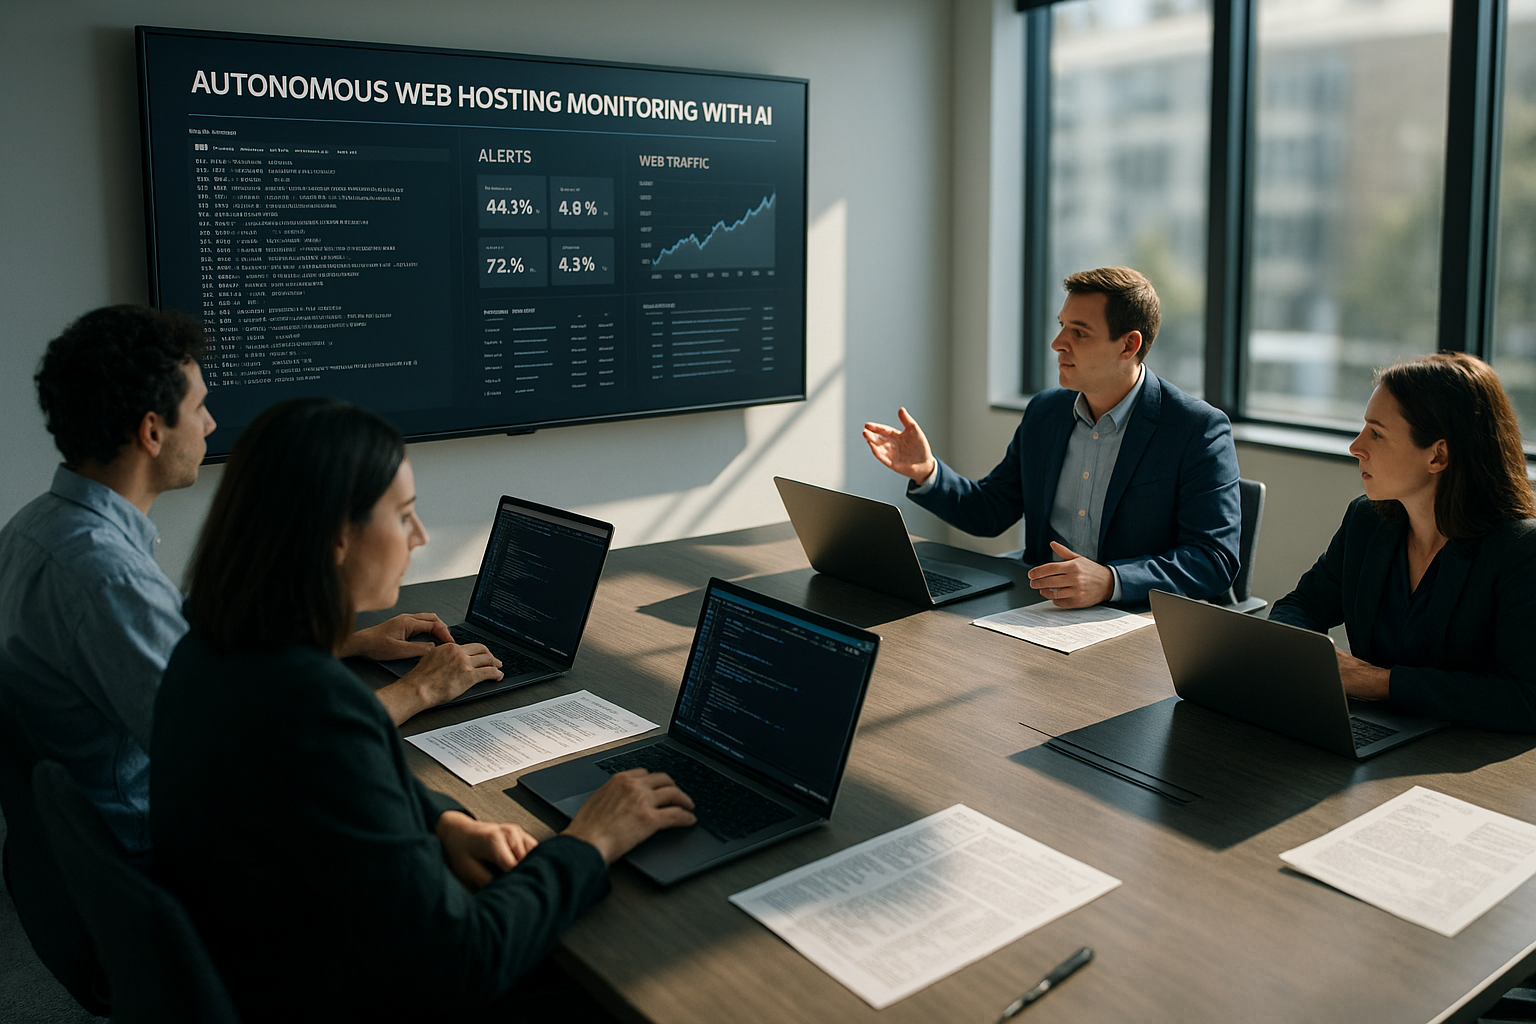
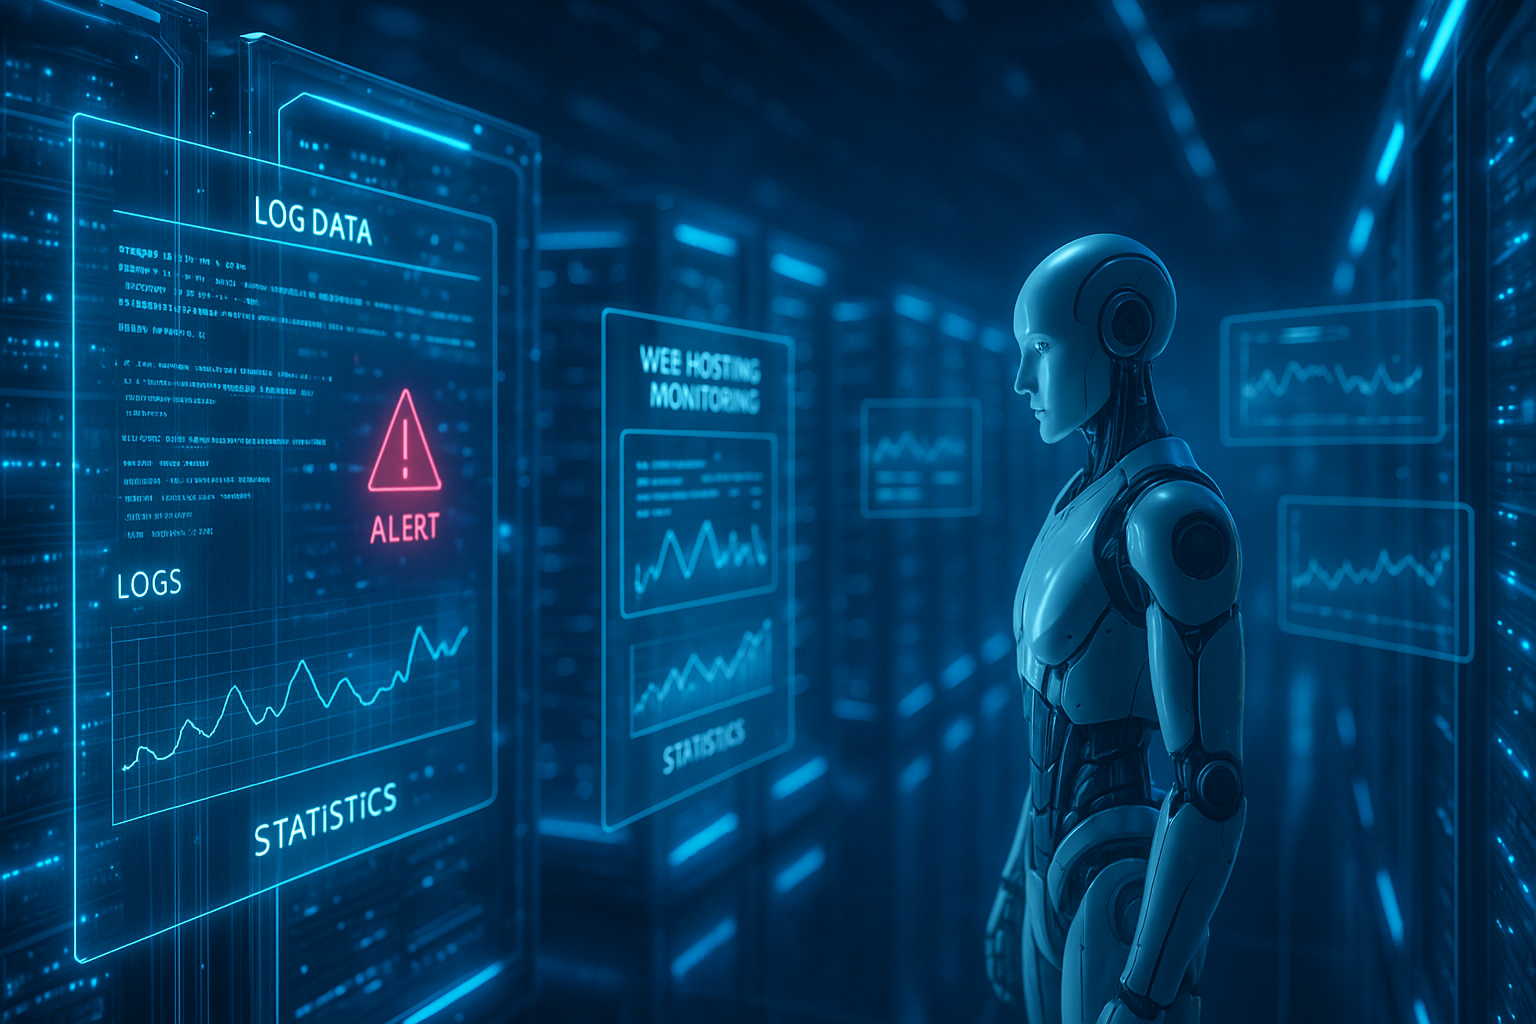
AI monitoring takes autonomous web hosting to a new level: I analyze logs in real time, automate alerts and identify trends before users notice anything. This allows me to control self-healing workflows, plan capacities with foresight and reliably keep services in the green - without a queue for human approvals and with clear Decision rules.
Key points
The following aspects form the compact framework for the following in-depth discussion and practical examples on the topic autonomous monitoring:
- Real-time analyses transform log floods into actionable hints.
- Automated alerts trigger specific workflows and self-healing.
- Trend models support capacity planning and cost control.
- Security events are noticed before damage occurs.
- Governance policies make decisions comprehensible.

What is autonomous monitoring in web hosting?
Autonomous monitoring describes systems that independently observe and evaluate logs, metrics and traces and derive actions from them without being bound by rigid rules; I use these capabilities on a daily basis to drastically reduce response times and mitigate risks. Thanks to Machine learning-models, I identify baselines, recognize deviations and initiate workflows that execute tickets, scripts or API calls. This allows me to intervene earlier, keep services available and relieve teams of routine work. Decision logic remains transparent and auditable so that every action remains traceable. This enables me to achieve high service quality, even though data volumes and system diversity are growing.
From rigid thresholds to learning systems
In the past, rigid threshold values and simple regex rules blocked the view of the essentials because they generated noise or overlooked critical patterns. Today, modeling AI typical load profiles, fault frequencies and seasonal peaks automatically. I continuously learn and update models so that they take into account the time of day, release cycles and holiday effects. If a value falls outside the learned spectrum, I immediately mark the event as an anomaly and assign it to contexts such as service, cluster or client. In this way, I replace rigid rules with dynamic normality - and significantly reduce false alarms.

How AI reads and acts on logs in real time
First, I collect data at all relevant points: System logs, application logs, access logs, metrics and events flow into a stream, which I classify and enrich in a standardized way. For heterogeneous formats, I use parsers and schemas so that structured and unstructured entries can be used; a clean Log aggregation in hosting. I then train models on historical and fresh data to recognize baselines and signatures; this is how I distinguish typical errors from unusual patterns. In live operation, I evaluate every incoming entry, calculate deviations and aggregate these into incidents with contextual information. If anomalies occur, I initiate defined playbooks and document every action for subsequent audits - this makes decisions easier. comprehensible.
Automate alerts and orchestrate self-healing
An alert alone does not solve a problem; I link signals with specific measures. In the event of increased latency, for example, I restart specific services, temporarily extend resources or empty caches before users notice any delays. If a deployment fails, I automatically roll back to the last stable version and synchronize configurations. I keep all steps as playbooks, test them regularly and refine triggers so that interventions are carried out with pinpoint accuracy. This keeps operations proactive and I keep the MTTR low.
Trend analyses and capacity planning
Long-term patterns provide tangible indications for capacities, costs and architecture decisions. I correlate utilization with releases, campaigns and seasonalities and simulate load peaks in order to cushion bottlenecks at an early stage. On this basis, I plan scaling, storage and network reserves with foresight instead of having to react spontaneously. Dashboards show me heat maps and SLO drifts so that I can manage budgets and resources in a predictable way; additions such as Performance monitoring increase the informative value. This is how I keep services efficient and secure at the same time Buffer for unforeseen events.

Practice: typical hosting workflows that I automate
Patch management is time-controlled with a prior compatibility check and a clear rollback path if telemetry shows risks. I plan backups on a risk-oriented basis and deduct frequency and retention from failure probabilities and RPO/RTO targets. In the event of container problems, I reschedule pods, pull fresh images and renew secrets as soon as signals indicate corrupt instances. In multi-cloud setups, I use uniform observability so that I can apply policies centrally and reactions remain consistent. I keep data accesses auditable so that security teams are aware of every change. check can.
Governance, data protection and compliance
Autonomy needs guard rails, which is why I formulate policies as code and define approval levels for critical actions. I log every AI decision with a timestamp, context and fallback plan so that audits remain seamless and risks are limited. I process data reduced to the necessary minimum, pseudonymized and encrypted; I strictly adhere to data residency rules. I keep a fine line between role and rights concepts so that broad insights are possible, while only selected accounts are allowed to intervene. Game days set targeted disruptions so that self-healing mechanisms can be reliably implemented. react.
Architecture: from the agent to the decision
Lightweight agents collect signals close to workloads, normalize them and send them to ingest-enabled endpoints with deduplication and rate limits. A processing layer enriches events with topology, deployments and service tags to help me identify root causes faster. Feature stores provide baselines and signatures so that models constantly use up-to-date contexts during inferencing. The decision level links anomalies to playbooks that trigger tickets, API calls or remediation scripts; feedback flows back into the model feedback. In this way, the entire cycle remains recognizable, measurable and controllable.
Provider check: AI monitoring in comparison
Functions differ significantly, which is why I look at real-time capability, depth of automation, self-healing and trend analyses. Clean integrations into existing toolchains are particularly important, as interfaces determine effort and impact. In many projects, webhoster.de scores points with end-to-end AI mechanisms and strong orchestration; predictive approaches support predictive maintenance, which I see as a clear advantage. I ensure a quick start by defining core metrics in advance and expanding playbooks step by step; this way, automation grows without risk. For more in-depth planning Predictive maintenance as reusable Building block.
| Provider | Real-time monitoring | Predictive maintenance | Automated alerts | Self-Healing | Depth of integration | AI-supported trend analysis |
|---|---|---|---|---|---|---|
| webhoster.de | Yes | Yes | Yes | Yes | High | Yes |
| Provider B | Yes | Partial | Yes | No | Medium | No |
| Provider C | Partial | No | Partial | No | Low | No |
KPI set and metrics that count
I control AI monitoring with clear figures: SLO fulfillment, MTTR, anomaly density, false alarm rate and cost per event. I also monitor data latency and capture rate to ensure that real-time assertions hold up in practice. For capacity, I look at utilization peaks, 95th and 99th percentiles, I/O wait times and memory fragmentation. On the security side, I check for unusual login patterns, policy violations and anomalies in data outflows to detect incidents early. I link these KPIs to dashboards and budget targets, so that technology and profitability can be combined. work.
Data quality, cardinality and schema evolution
Good decisions start with clean data. I establish clear schemas and versioning so that logs, metrics and traces remain compatible in the long term. I deliberately limit fields with high cardinality (e.g. free user IDs in labels) in order to avoid cost explosions and unperformant queries. Instead of uncontrolled label floods, I use whitelists, hashing for free text and dedicated fields for aggregations. For unstructured logs, I introduce structuring step by step: first rough classification, then finer extraction as soon as patterns are stable. I use sampling in a differentiated way: Head sampling for cost protection, tail-based sampling for rare errors so that valuable details are not lost. For schema changes, I publish migration paths and adhere to transition times so that dashboards and alerts function continuously.
I continuously check raw data against quality rules: Mandatory fields, value ranges, timestamp drift, deduplication. If violations become apparent, I mark them as separate incidents so that we can correct causes early on - such as incorrect log formatter in a service. In this way, I prevent the AI from learning from questionable signals and keep the informative value of the models high.
MLOps: Model life cycle in monitoring
Models only perform if their life cycle is professionally managed. I train anomaly detectors on historical data and validate them on „calibrated weeks“ in which there are known incidents. I then start in shadow mode: the new model evaluates live data but does not trigger any actions. If precision and recall are right, I switch to controlled activation with tight guardrails. Versioning, feature stores and reproducible pipelines are mandatory; in the event of drift or performance drops, I automatically roll back models. Feedback from incidents (true/false positive) flows back as a training signal and improves the classifiers. This creates a continuous learning cycle without sacrificing stability.

Operationalize SLOs, SLIs and error budgets
I no longer base alerts on naked thresholds, but on SLOs and error budgets. I use burn rate strategies over several time windows (fast and slow) so that short-term outliers do not escalate immediately, but persistent degradation is quickly noticed. Each escalation level carries specific measures: from load balancing and cache warm-up to traffic shaping and read-only mode. SLO drifts appear in dashboards and flow into postmortems, making it possible to see which services are systematically consuming budget. This coupling ensures that automatisms respect economic and qualitative goals at the same time.
Multi-tenancy and multi-client capability
In the hosting environment, I often work with shared platforms. I strictly separate signals by client, region and service tier so that baselines learn per context and „noisy neighbors“ do not cast a shadow. Quotas, rate limits and prioritization belong in the pipeline so that a tenant with log spikes does not jeopardize the observability of other services. For client reports, I generate comprehensible summaries with impact, cause hypothesis and measures taken - auditable and without sensitive cross-references. This ensures isolation, fairness and traceability.

Security integration: from signals to measures
I dovetail observability and security data so that attacks become visible at an early stage. I correlate unusual auth patterns, lateral movements, suspicious process spawns or cloud configuration drift with service telemetry. Reaction chains range from session isolation and secret rotation to temporary network segmentation. All actions are reversible, logged and bound to release guidelines. Low-and-slow detections are particularly valuable: slow data exfiltration or creeping expansion of rights are detected via trend breaks and anomaly compression - often before classic signatures take effect.
Cost control and FinOps in monitoring
Observability must not itself become a cost driver. I define costs per incident and set budgets for ingest, storage and compute. I keep hot storage in short supply for current incidents, while older data is moved to cheaper tiers. Aggregations, metric roll-ups and differentiated sampling reduce volumes without losing diagnostic capability. Predictive analyses help to avoid overprovisioning: I scale with foresight instead of permanently holding large reserves. At the same time, I monitor the „cost latency“ - how quickly cost explosions become visible - so that countermeasures take effect in good time.

Testing, chaos and continuous verification
I only trust automation when it proves itself. Synthetic Monitoring continuously checks core paths. Chaos experiments simulate node failures, network latencies or faulty deployments - always with a clear termination criterion. I test playbooks like software: unit and integration tests, dry run mode and versioning. In staging environments, I verify rollbacks, credential rotation and data recovery against defined RPO/RTO targets. I transfer findings to runbooks and train on-call teams specifically for rare but critical scenarios.
Implementation schedule: 30/60/90 days
A structured start minimizes risks and delivers early results. In 30 days, I consolidate data collection, define core metrics, build initial dashboards and define 3-5 playbooks (e.g. cache reset, service restart, rollback). In 60 days, I establish SLOs, introduce shadow models for anomalies and activate self-healing for low-risk cases. This is followed in 90 days by client reports, cost controls, security correlations and game days. Each phase ends with a review and lessons learned to increase quality and acceptance.
Edge and hybrid scenarios
In distributed setups with edge nodes and hybrid clouds, I take intermittent connections into account. Agents buffer locally and synchronize with backpressure as soon as bandwidth is available. Decisions close to the source shorten latencies - such as local isolation of unstable containers. I keep configuration states declarative and replicate them reliably so that edge locations act deterministically. In this way, autonomy remains effective even where central systems are only temporarily accessible.
Risks and anti-patterns - and how I avoid them
Automation can create escalation loops: aggressive retries exacerbate load peaks, flapping alerts fatigue teams, and lack of hysteresis leads to „fidgeting effects“. I use backoff, circuit breakers, quorums, maintenance windows and hysteresis curves. Actions run idempotently, with timeouts and clear abort rules. Critical paths always have a manual override mechanism. And: No playbook without a documented exit and rollback path. This keeps benefits high while risks remain manageable.
Practical examples in depth
Example 1: A product campaign generates 5x traffic. Even before peak times, trend models recognize rising request rates and increasing 99 latency. I preheat caches, increase replica numbers and scale the database read nodes. When the burn rate exceeds a threshold value, I throttle compute-intensive secondary jobs so that the error budget doesn't tip over. After the peak, I roll back capacities in an orderly fashion and document cost and SLO effects.
Example 2: In container clusters, OOM kills accumulate in a namespace. The AI correlates deploy times, container version and node types and marks a narrow time window as an anomaly. I trigger a rollback of the faulty image, temporarily increase limits for affected pods and clean up leaks in sidecars. At the same time, I block new deployments via a policy until the fix is verified. MTTR remains low because detection, cause and chain of measures are interlinked.
Outlook: where autonomous monitoring is heading
Generative assistants will create, test and version playbooks, while autonomous agents will delegate or execute decisions themselves depending on the risk. Architectural decisions will be based more on learning curves; models will recognize subtle changes that previously went undetected. I expect observability, security and FinOps to be more closely interlinked so that signals work across the board and budgets are spared. At the same time, the importance of explainability is increasing so that AI decisions remain transparent and verifiable. Those who lay the basic components now will benefit early on from productivity and Resilience.
Summary
Autonomous monitoring combines real-time analysis, automated response and predictable optimization in a continuous cycle. I continuously read logs, identify anomalies and take targeted measures before users notice any restrictions. Trend models provide me with planning security, while governance rules safeguard every decision. A clean start is achieved with data collection, baselines and a few, well-tested playbooks; I then scale up step by step. This keeps hosting available, efficient and secure - and AI becomes a multiplier for operations and growth.


