
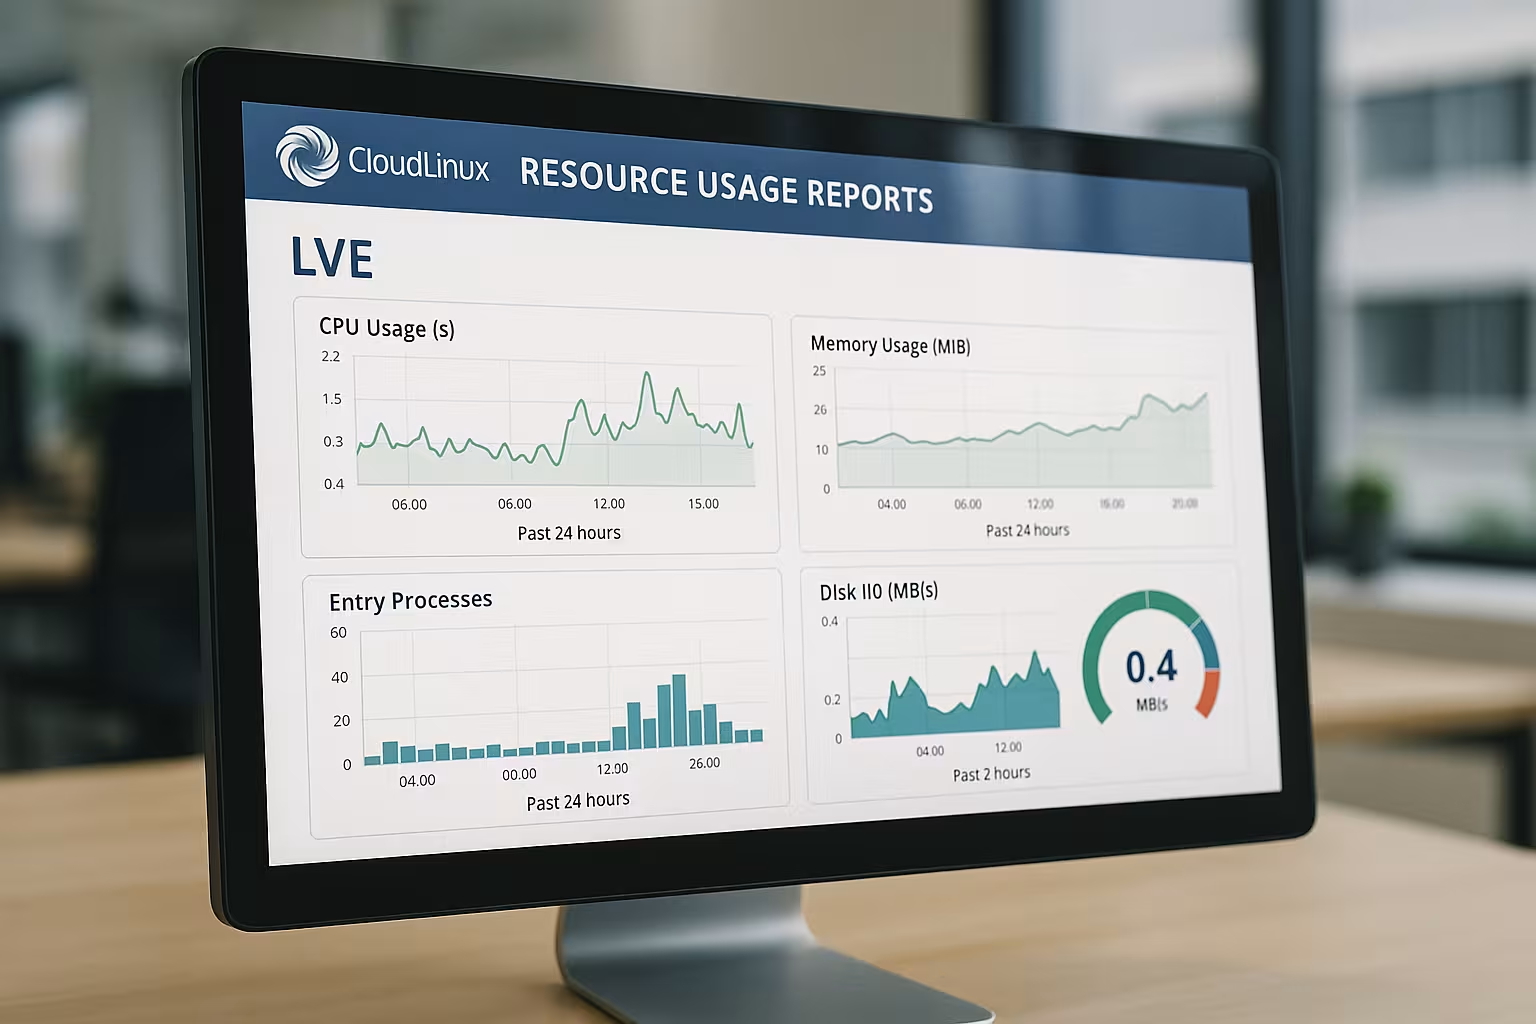
CloudLinux Reports clearly show me which LVE limits apply to individual accounts and where CPU, memory, I/O, or entry processes are actually causing bottlenecks. I analyze this data specifically to identify recurring faults, daily patterns, and acute bottlenecks, and to derive concrete optimization measures from them.
Key points
I'll summarize the following key points up front so you can get started on the analysis with a clear focus.
- LVE Key Figures Read correctly: SPEED, MEM, IO, IOPS, PNO, EP
- Live Data Check using LVE Manager and lvetop
- History via lveinfo, lvechart, cloudlinux-statistics
- Faults Prioritize: Frequency, Timing, Cause
- Measures Derive values for CPU, RAM, I/O, and EP

Understanding the Key Metrics: SPEED, MEM, IO, IOPS, PNO, EP
I start every analysis with the Key figures, as reported by CloudLinux in the LVE context. SPEED describes the allocated CPU processing power, MEM stands for RAM usage, IO for data throughput, and IOPS for the number of I/O operations. PNO shows the total number of running processes, and EP shows the concurrent entry processes that limit web access. If you consistently see high values, you’re usually dealing not with a short-term peak issue but with a structural load profile. I always check whether limits are being continuously reached or whether there are only isolated spikes that can be explained without throttling.
| Key figure | Meaning | Typical Symptoms | Initial Checks |
|---|---|---|---|
| SPEED | CPU Performance (Percentage/Limit) | Long PHP execution times, timeouts | Check PHP Profiles, Opcode Cache, and Caching |
| MEM | Memory per Account | OOM kills, 500 errors under load | Review PHP memory_limit, plugins, and queries |
| IO | Throughput in MB/s | Slow Downloads/Uploads | Static Cache, Media Compression, Storage |
| IOPS | Number of I/O Operations | Slow DB/File Accesses | Indexes, Query Plan, Object Cache |
| PNO | Overall Processes | Increased server load | Daemon/Cron Overruns, Worker Limits |
| EP | Simultaneous Web Accesses | 503 Error in Peaks | Check HTTP Cache, Rate Limits, and Bots |
Live Monitoring with LVE Manager and lvetop
For quick analyses, I use the Live Data in the LVE Manager and lvetop at the command line. The Current Usage view shows me in real time how the CPU, RAM, I/O, IOPS, processes, and entry processes are performing. During peak loads, I monitor whether EP or SPEED reaches its limit first, as this influences the next steps. lvetop is useful for immediately filtering out the most resource-intensive accounts and, if necessary, throttling or optimizing them. If you want to dive deeper into the interface, you can customize limits and views—I like to use this guide for that: Configure LVE Manager.

Historical Analysis: lveinfo, lvechart, and cloudlinux-statistics
I spot trends through History and fault history—not just snapshots. With lveinfo, I can draw time windows and see exactly when limits were triggered and how often that happened. lvechart provides me with visual peaks over hours or days, revealing patterns throughout the day. cloudlinux-statistics complements the analysis when I need longer time series per account. By combining these tools, I gain answers to the questions „when,“ „how often,“ and „under what conditions“ loads occur.
Understanding and Prioritizing Faults
A "Fault" means: The Limit was triggered, and CloudLinux throttled the process. So I sort faults first by frequency, then by resource type and time of day. Daily EP faults around noon often indicate traffic spikes or bots, while nighttime RAM faults are more likely related to cron jobs and backups. If CPU faults are frequent, I look for inefficient PHP routines, faulty caches, or unchecked tasks. This categorization saves time because I can target optimizations exactly where users are noticeably impacted.
Identifying Causes: Typical Patterns and Countermeasures
Based on my experience, I classify Sample quickly pinpoint specific causes. Consistently high EP values indicate too many concurrent requests or a lack of edge caching. Persistently high RAM usage often points to plugins, themes, or leaky processes. IO and IOPS spikes indicate data-intensive tasks, unindexed queries, or numerous small file accesses. To avoid misinterpretations, I simultaneously check system health indicators—a quick way to get started is with the CloudLinux Health Checks.
Identifying Cron Jobs, Backups, and Bots
A look at [...], explains many "Fault" series Points in time and tasks. If the throttling occurs shortly after the hour, cron jobs are often running in parallel and competing with visitors. Recurring peaks at night frequently indicate backups that are maxing out I/O and IOPS. Notable EP faults without corresponding traffic in Analytics often indicate bots or scrapers bypassing static content. In such cases, I set rate limits, reschedule jobs for quieter time slots, and consistently enable edge or page caches.

Analyze Data by Reseller and Account
In larger setups, I separate the Levels Clear: Resellers, their customers, and individual accounts. The LVE Manager provides exactly this view and shows me which sub-tree is driving the limits. This allows me to see whether a single customer stands out or whether multiple projects within a reseller structure are putting pressure on the system at the same time. For support processes, I flag affected accounts and document actions to be taken so that recurring tickets can be resolved more quickly. This transparency helps ensure resources are allocated fairly and keeps costs per client traceable.
Properly Set Thresholds and Adjust Rates
I set limits Realistic, not at the maximum. EP limits that are too tight cause 503 errors, while SPEED values that are too low slow down every PHP response. If you regularly see errors, check optimizations first and then the pricing plans. When projects become business-critical, it’s worth upgrading to a higher plan that smooths out peaks and ensures consistency. I document the effects in the trend graphs so that the decision remains transparent.

Database-Intensive Projects: Optimizing I/O and IOPS
For database-driven sites, I check IOPS and I/O always goes hand in hand with query quality. Many small queries without indexes generate high IOPS and slow down response times. Experience has shown that object caching, query caching, and customized indexes significantly reduce this flood of queries. For trend analysis, I also review the database reports and compare them with LVE trends. This guide provides me with a solid introduction to MySQL Governor Reports, in order to accurately classify the database load.
Monitoring Playbook: From Alert to Action
I use the measured values to create a Playbook, which clearly maps out every escalation. Step 1: Check in real time whether limits are currently in effect and which resource fails first. Step 2: Open the history, compare time frames, and flag recurring instances. Step 3: Pin down the cause—code path, cache, database, cron, bot—and define a corrective action with test criteria. Step 4: After implementing the fix, check both live and historical data again to see if faults and latency have decreased. This fixed sequence prevents knee-jerk reactions and ensures reproducible results.

Interpreting the Interdependencies of Limits Correctly
In practice, limits rarely apply in isolation. That is why I evaluate the Interactions Between EP, SPEED, MEM, and IO/IOPS: If EP and SPEED rise simultaneously, the CPU is usually the limiting factor per request; a page or edge cache can help in this case, causing both metrics to drop together. If I see elevated EP with consistently low SPEED, requests are backing up in the web server—often due to a shortage of workers, Keep-Alive configurations, or blocking external calls (e.g., API, email). MEM faults at moderate SPEED levels indicate a small number of memory-hungry processes (such as image conversion or large exports). IO/IOPS peaks without significant CPU load indicate data-intensive file or database access. I use these correlations to determine the first hypothesis to establish before I delve deeper into code or server details.
Practical Application: Using lvetop, lveinfo, and cloudlinux-statistics Efficiently
To ensure quick results, I work with clear Queries and filtering. lvetop helps me see the top consumers every second and switch between CPU, MEM, or IO sorting. With lveinfo, I set 1-hour, 24-hour, and 7-day windows to list fault times, peak values, and affected resources per account. cloudlinux-statistics provides me with longer time series and is useful for documenting the impact of measures (before/after). For every intervention, I always document: the time period, affected accounts, maximum values per resource, number of faults, and response times from application or web monitoring. This allows me to substantiate optimizations and prevent limits from being loosened „on a hunch.“.
Web Stack Details: PHP Handlers, Workers, and OPcache
A major lever lies in the PHP Execution: The number of PHP workers per account, their RAM budget (memory_limit), and the OPcache. Too many workers without a cache increase EP/PNO and MEM; too few workers cause requests to back up (EP increases, response time rises). I therefore determine a sweet spot: as many workers as necessary, as few as possible. The OPcache must be sufficiently sized (memory and interned strings); otherwise, PHP constantly recompiles and drives up SPEED. Additionally, I check whether static resources are actually served by the web server (and not by PHP) and whether Keep-Alive and HTTP/2 multiplexing are working correctly. The goal is to handle dynamic requests reduce and to work through the remaining ones quickly.
Consistently Implement Caching Strategies
I distinguish between three levels: Edge/CDN cache for global relief, HTTP/Page Cache immediately before PHP and Object cache within the application. The edge cache drastically reduces EP and I/O for static assets. The page cache reduces dynamic hits and directly impacts EP/SPEED. The object cache (e.g., for frequent database lookups) reduces IOPS and CPU usage. It is important to have a stable Cache key (e.g., no unnecessary cookies) as well as appropriate TTLs for each page type. I plan to make exceptions for admin and shopping cart areas; everywhere else, I aim for the highest possible cache hit rate. After activation, I monitor the following: Are there any EP faults? Are median response times decreasing?
RAM Management: memory_limit, Processes, and Leaks
MEM faults often occur because memory_limit is set generously, and parallel processes can cause the total to exceed the limit. So I calibrate: how much RAM does a typical request need? From that, I determine the maximum reasonable number of workers. In addition, I keep PHP libraries and plugins lean, remove unused extensions, and check long-running scripts (exports, imports, image processing) for leaks. The OPcache reduces RAM pressure by caching compiled code, but its size itself must not be too small. For recurring peaks, I use profiling to isolate the „costly“ paths and address them specifically—this often saves more RAM than blanket limit increases.
Targeted Reduction of I/O and IOPS
IO/IOPS spikes are caused by many small file or database accesses. I consolidate workloads wherever possible: thumbnail generation as a batch rather than on-demand, asset minification during the build rather than with every request, and session and transient storage into a single Object cache Outsource this to reduce the number of file accesses. In the database, I prioritize indexes for common WHERE/JOIN clauses and eliminate N+1 queries. At the same time, I compare LVE logs with the database reports from the MySQL Governor to identify hotspots. The goal is to consolidate many small IOPS into a few efficient accesses—this smooths out peaks and reduces the likelihood of failures.
Mitigating EP Errors: Queuing and Visitor Flows
EP limits concurrent accesses. If many requests hit sparse caches, EP faults can quickly pile up. I prevent this by Queues Before implementing PHP (to keep request queues short on the web server), I set Keep-Alive appropriately and ensure that dynamic paths that aren't personalized are consistently cached. For bots, I define rate limits and block obvious bad actors early on. Additionally, I check for third-party calls in the request path—blocking external services increase the dwell time per request and thus consume EP. Where possible, I move external integrations to jobs or queues.
Scheduling Cron Jobs and Backups to Conserve Resources
I decouple recurring tasks from peak times and regulate them: I spread out cron jobs (by shifting them by minutes), prevent parallel runs using lock files, and regulate the load via Nicing and batch sizes. I schedule backups for time slots with low traffic and make sure to use incremental methods so that IO/IOPS stay within reasonable limits. For resource-intensive in-app jobs, I set limits on the number of concurrent workers to prevent MEM and SPEED from spiking. I monitor the impact over time: Do nightly faults decrease? Do load spikes subside after the hour?
CageFS: A Look at the File System and Inodes
In addition to LVE limits, the following factors influence File System Factors Performance: Millions of small files (such as cache fragments) increase metadata accesses and drive up IOPS. I keep cache directories tidy, limit the flood of files by using sensibly aggregated caches, and monitor inode usage. CageFS provides isolation, but incorrectly placed temporary files (e.g., in the webroot instead of the tmp directory) unnecessarily increase I/O. A periodic health check of these areas prevents I/O bottlenecks from being mistakenly interpreted as purely CPU- or RAM-related issues.
Transparency and Communication in the Reseller Context
In reseller environments, I document Load driver For each sub-system, I document measures: What limits have been set? What optimizations are planned? What do the before-and-after graphs look like? This transparency speeds up support responses and builds acceptance for rate plan changes when optimization potential has been exhausted. I establish thresholds at which we take action (e.g., recurring faults > N/day or median response time > X ms) and link them to clear action plans—this prevents endless loops in the ticketing system.
Avoiding Common Misinterpretations
There are a few patterns I see regularly: Rising CPU usage is not This automatically indicates „insufficient CPU“—often because caches aren’t working or queries are inefficient. A high number of EP faults does not necessarily mean „more traffic“—bots, misconfigured monitoring tools, or heartbeats can be the cause. MEM faults cannot always be resolved by increasing the `memory_limit`—often, there are simply too many concurrent processes. IO/IOPS peaks aren’t solely due to storage—they’re triggered by application patterns. I therefore always verify hypotheses using correlated charts and, when possible, with quick countertests (e.g., enabling the cache for a specific section and rechecking the history).
Test, measure, resharpen
I rate each change with clear measurement points: before/after page cache activation, before/after index updates, before/after worker adjustments. To do this, I use LVE history, response time metrics, and error rates (5xx/4xx). Whenever possible, I conduct A/B tests during off-peak hours to isolate side effects. If faults persist, I iterate: fine-tune limit combinations, profile additional hot paths, and adjust job batch sizes. Experience shows that two to three targeted iterations yield significantly better results than one large, blanket measure.
Summary: How I Read CloudLinux Resource Usage Reports Efficiently
I rate CloudLinux-Data is always organized into three levels: Live, History, and Faults. The metrics SPEED, MEM, IO, IOPS, PNO, and EP provide me with a roadmap for cause and effect. With `lvetop`, I can immediately see what’s causing the load; with `lveinfo` and `lvechart`, I can identify patterns over the course of days. Based on recurring faults, I determine the need for caching, query tuning, limit adjustments, or plan changes. This method reduces support costs, improves responsiveness, and makes hosting performance transparent.


