Skip to content
A Monitoring stack with Grafana and Prometheus provides web hosts and their customers with a clear view of performance, availability, and security—from individual servers to entire Kubernetes clusters. I describe how Hosting-Use team dashboards, alerts, and self-service analytics to detect disruptions early and reliably maintain SLAs.
Key points
I will briefly summarize the following points in advance so that you can see the most important aspects at a glance.
- Prometheus as a central metrics backbone
- Grafana for transparent dashboards
- alert manager for quick responses
- Kubernetes-Monitoring out of the box
- Multi-tenancy and rights concepts

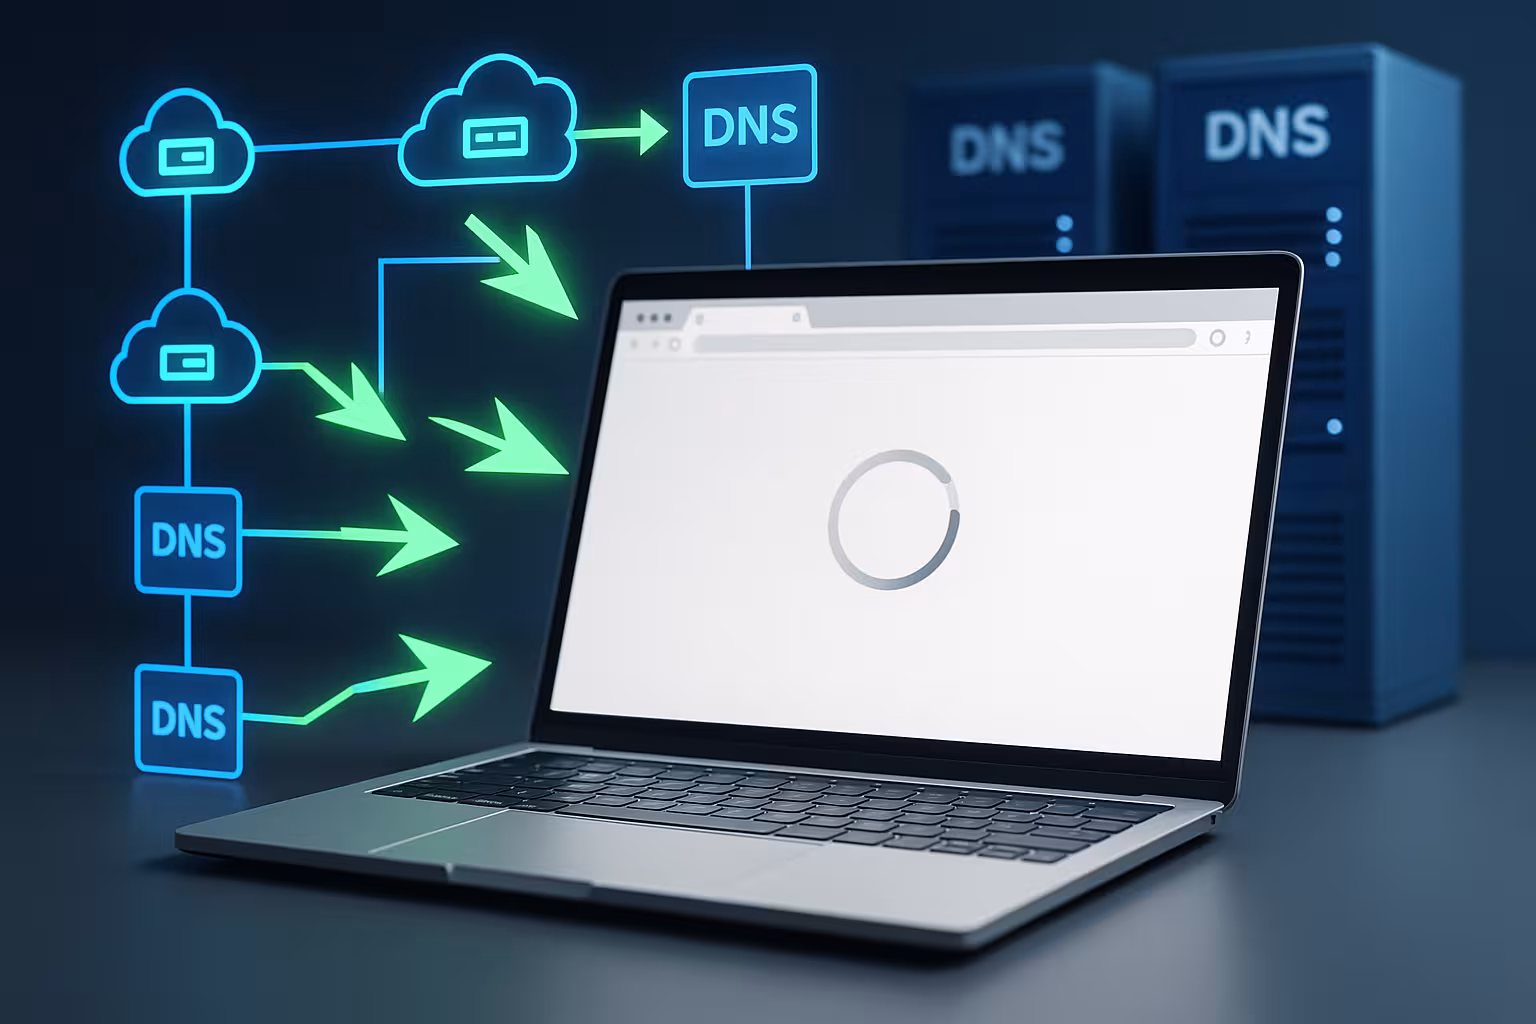
Why hosting needs a monitoring stack
Modern hosting environments move workloads into containers, orchestrate services, and scale dynamically, so I need a Overview, that remains reliable at all times. Classic checks are not sufficient for this because they hardly reflect bursts, seasonality, and dependencies, which makes root cause analysis difficult and prolongs response times. A neatly structured stack of Prometheus and Grafana shows me in real time how CPU, RAM, I/O, and latencies are performing and signals anomalies before users notice anything. I connect all relevant exporters, assign meaningful labels, and keep cardinality in check so that queries remain fast and dashboards respond immediately. This is how I increase the Transparency for support teams and enable my customers to securely self-service their own services.
Prometheus Hosting – Metrics under control
Prometheus continuously collects metrics from servers, containers, and applications, which is why I consistently rely on Labels and recording rules for fast queries. I start with core metrics such as CPU, RAM, disk, and network, and gradually expand to include application values such as requests, error rates, and queue lengths. I use PromQL to formulate alerts that address root causes, such as increasing errors with simultaneous latency increases, and send them to the appropriate channels via Alertmanager. For dynamic environments, I use Service Discovery so that new nodes or pods are automatically integrated and no metrics are lost. For those who want to dive deeper, I recommend starting with the Monitor server utilization, to consistently record and evaluate the most important key figures; this ensures that the Performance tangible.

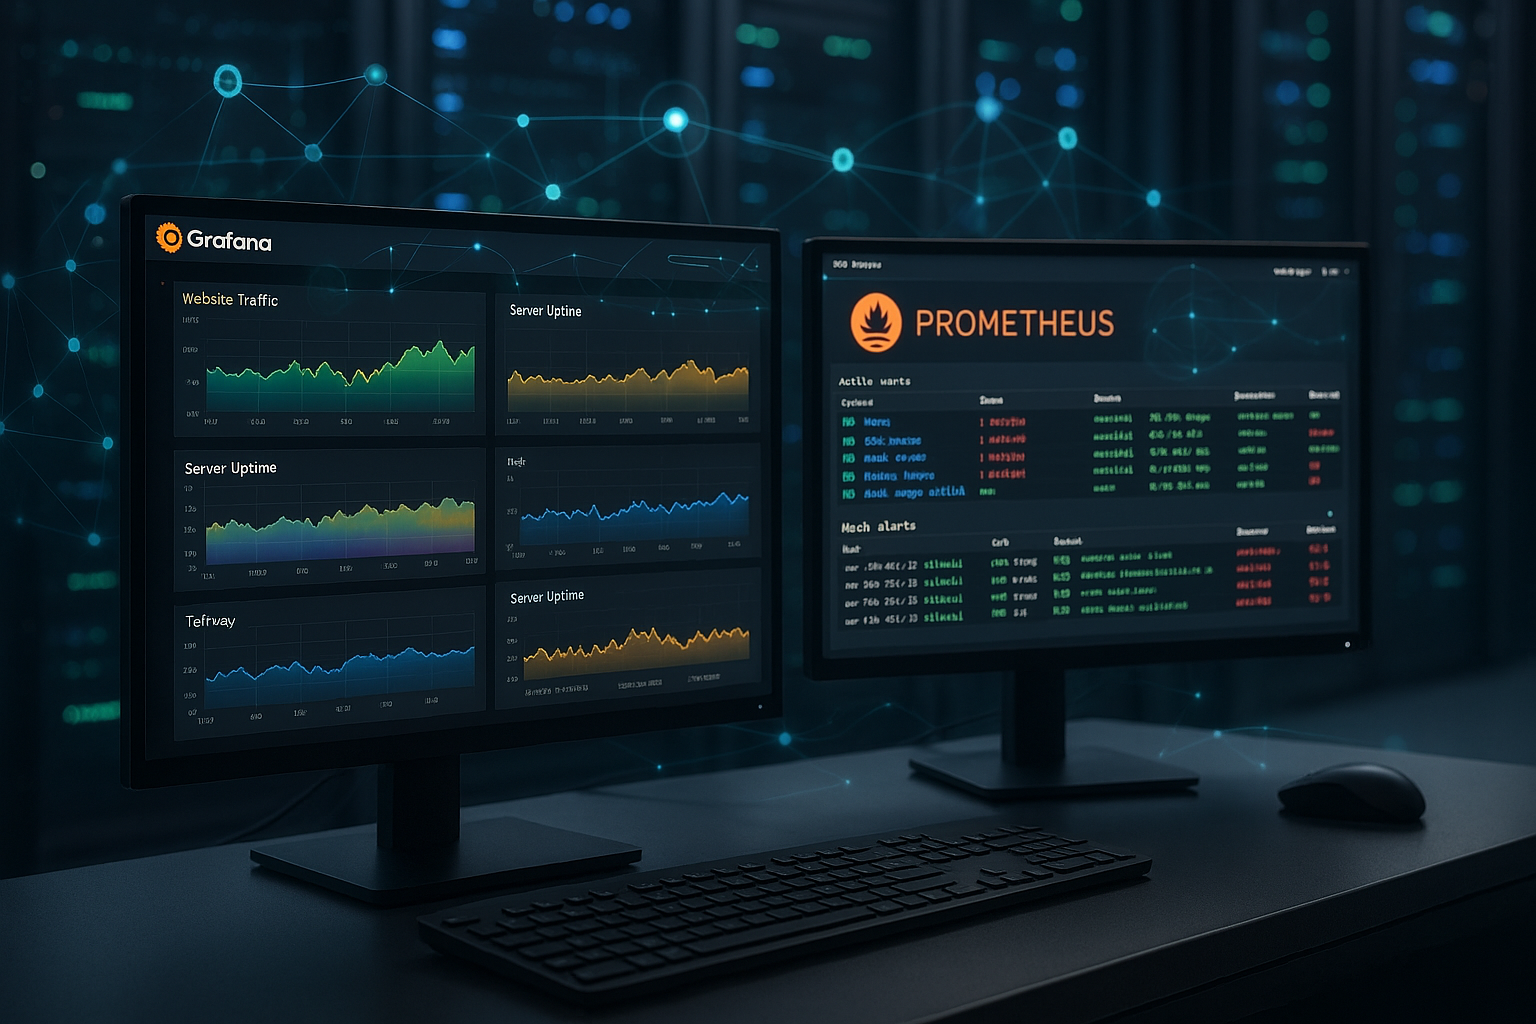
Grafana Hosting – Dashboards for operators and customers
Grafana makes data visible, which is why I build thematic dashboards for infrastructure, applications, and business metrics so that everyone participants sees exactly what they need. Customers get client workspaces with roles and folders, ensuring data separation and convenient self-service. I use variables and templates so that teams can interactively filter and compare individual hosts, namespaces, or deployments. Annotations in panels link changes or incidents directly to metrics, which greatly speeds up root cause analysis. For quick ad hoc analysis, I add Explore views so I can build queries, test hypotheses, and Cause quickly narrow down.
Exporter portfolio and metric standards
To ensure that the stack is broadly supported, I define a basic set of exporters: node_exporter for hosts, cAdvisor and kube-state-metrics in Kubernetes, Blackbox Exporter for HTTP(S), TCP, ICMP, and DNS, plus targeted exporters for databases and caches (e.g., PostgreSQL, MySQL/MariaDB, Redis) and web servers/ingress. I make sure that metric names and units are consistent and use histograms for latencies with sensibly chosen buckets so that percentiles are reliable. I standardize scrape intervals, timeouts, and retries for each component type to avoid load peaks. I consider labels such as tenant, cluster, namespace, service, and instance to be mandatory, and I document optional labels so that cardinality does not grow uncontrollably. This keeps queries stable and dashboards comparable.
Synthetic monitoring and user perspective
In addition to internal metrics, I incorporate synthetic checks that reflect the user's perspective. I use Blackbox Exporter to check availability, TLS validity, redirects, and DNS response times—ideally from multiple regions to measure network paths and CDNs. For web apps, I use simple transaction checks (canaries) and supplement server-side metrics such as time-to-first-byte at the ingress. I base SLOs for availability and latency on these end-to-end perspectives and correlate them with backend signals. This allows me to identify whether a problem lies in the network, the app, or the infrastructure and to credibly verify SLAs.
Kubernetes and container environments
In clusters, I use the operator approach to ensure that Prometheus, Alertmanager, and Exporter run reliably and that the recording follows new deployments. Pre-built dashboards for nodes, pods, workloads, and ingress clearly highlight bottlenecks and provide early warning of saturation or failures. I focus on SLOs: availability, latency, and error rate, which I evaluate for each service and namespace. With namespace labels, resource limits, and workload types, I keep metric cardinality under control and stay fast with queries. As clusters grow, I distribute scrapes, segment jobs, and use federation so that the Scaling goes smoothly.
Architecture of the Monitoring Stack Hosting
I plan the stack in clear layers: exporters and applications deliver metrics, Prometheus collects and stores them, the alert manager sends messages, and Grafana visualizes them. Results. For long-term data, I rely on remote write to a long-term TSDB so that retention and query load remain neatly separated. I calculate frequently used time series using recording rules, which keeps dashboards fast and reliable. I document jobs, labels, naming conventions, and alert strategies to ensure smooth operation and handover. Backups of the TSDB directory, health checks of the instances, and a well-designed update window ensure the Availability additionally.
Automation and GitOps
To ensure configurations remain reproducible, I manage them as code: I version scrape targets, rules, and alerts in Git, and automate provisioning for Grafana data sources and dashboards. In Kubernetes, I use the operator and Helm charts, and outside of Kubernetes, I rely on Ansible or Terraform. Changes are made via pull requests with review and automatic validation (syntax checks, promtool) before they are rolled out. I encapsulate parameters such as endpoints, tenants, and retention in variables to ensure that stage/prod environments remain consistent. This keeps the stack manageable despite many clients and teams.
High availability and resilience
For high availability, I run Alertmanager in cluster mode and Prometheus in active redundancy: two scrapers with identical configurations but different external_labels ensure that alerts are only sent once and data is not counted twice. I shard jobs by client or workload so that individual instances remain smaller. Write-ahead logs and remote write buffers protect against brief interruptions; restore exercises regularly validate backups. For a global view, I aggregate via federation or use a separate long-term layer without overloading operational instances. I document and test failover processes so that they are ready in case of an emergency.

Comparison of components
To make decisions easier, I compare the most important building blocks and rank their usefulness for hosting teams that want to clearly map clients and SLA targets. The table shows which tasks the tools perform and how they interact when I combine transparency, speed, and reliability. I take into account visualization, metric collection, alerting, and optional log and trace analysis, because these levels together result in comprehensive observability. The classification helps me to set priorities and plan investments in a targeted manner. This keeps setup, operation, and further development transparent, and I maintain the Costs under control.
| Component | Task | Hosting benefits | Multi-tenancy |
|---|---|---|---|
| Prometheus | Collect & store metrics | Fast queries, flexible labels | Separation via labels/jobs |
| alert manager | Rules & Routing for Alerts | Early response, clear responsibilities | Recipients per client |
| Grafana | Dashboards & Analysis | Transparency for teams and customers | Folders, permissions, teams |
| Loki (optional) | Index & search logs | Rapid root cause analysis | tenant IDs |
| Tempo/OTel (optional) | Capture traces | end-to-end transparency | Insulated pipelines |
Best practices for multi-tenancy and security
I separate clients via teams, folders, and data sources in Grafana so that only authorized persons have access to the correct Data In Prometheus, I consistently adhere to label conventions so that client assignments, clusters, namespaces, and services are clearly identifiable. I manage secrets, credentials, and webhooks centrally and renew them regularly to minimize risks. Network rules and TLS secure the paths between exporters, scrape targets, and visualization, which reduces the attack surface. Auditing in Grafana and auditable alert configurations give me traceable Processes, when I check or report changes.
Compliance and data protection
I only collect data that I really need for operations and reporting, and I avoid personal details in labels. Where identifiers are necessary, I use pseudonymization or hashes and document deletion paths for clients. I set retention per tenant, tailored to contractual and legal requirements. Export functions and audit logs support requests for information, and access layers (SSO, roles, API tokens) prevent uncontrolled growth. This allows me to combine transparency with data protection and keep audits stress-free.

Logs and traces supplement metrics
Metrics show me the what, logs and traces show me the why, so I link panels with log and trace views for a consistent view. Analysis. I recommend structured logs and meaningful labels so that correlations between error codes, latency spikes, and deployments are immediately visible. I link dashboards directly to log streams so that I can jump from a peak to the relevant events. For backups of log indexes, I plan storage classes and retention per client so that compliance and costs are aligned. The overview at Log aggregation in hosting, who is the correlations between metrics, events, and auditing.
Queries, cardinality, and performance
I keep label values under control, avoid infinite dimensions such as user IDs, and check new labels before introducing them. In PromQL, I rely on aggregations with clear groupings (sum by, avg by) and avoid expensive regexes in hot queries. Frequent calculations end up as recording rules so that dashboards don't have to collect raw data every time. For latencies, I use histograms and consistently derive p90/p99; I explicitly limit top-N analyses (topk) and document their load. This keeps panels reactive and queries plannable—even with growing data volumes.
Scaling, federation, and storage strategies
As the infrastructure grows, I separate recording, processing, and long-term storage so that the Performance remains stable and queries are predictable. I use federation when I want to aggregate metrics across locations or clusters without keeping every data set centrally. Remote write to a long-term store allows me to store data for long periods and perform historical analyses, while operational instances remain lean. I monitor metric cardinality and limit highly variable label values so that storage and CPU don't get out of hand. To ensure that dashboards respond quickly, I summarize frequently used aggregations as recording rules and document the Limit values comprehensible.
Operational processes and SLA reporting
I link monitoring with incident management, change calendars, and on-call schedules so that the reaction runs smoothly in an emergency. Dashboards with SLO targets show fulfillment rates and outliers, which facilitates communication with customers. For weekly and monthly reports, I automatically export key figures and add comments on the context. Runbooks document the usual fault patterns, including measurement points, queries, and countermeasures. I hold review meetings after major incidents, check alarm noise, and adjust thresholds so that the signal quality increases.
Testability, alarm quality, and exercises
I test alerts with synthetic events and unit tests for rules before they go live. I check routes in Alertmanager with dry runs, silences are time-limited and commented. I measure MTTD/MTTR, track false positives, and clean up noise with cause-oriented rules (e.g., grouped failures instead of per host). Chaos and failover exercises validate that dashboards show the right signals, and runbooks guide you through remediation steps. This makes monitoring a reliable part of the incident workflow—not a flood of notifications.
Migration and onboarding
When switching from legacy systems, I run both systems in parallel for a while: Prometheus alongside existing checks to find gaps. I roll out Exporter step by step, starting with core environments and transferring dashboards from templates. Customers receive onboarding packages with predefined SLOs, roles, and sample alerts; I add individual requirements iteratively. This keeps operations stable while teams and clients get used to new perspectives.
Costs, licenses and operation
Open-source components reduce licensing costs, but I consciously plan time and Resources for operation, maintenance, and training. Grafana Enterprise can be worthwhile if rights management, reports, or support are important, while community versions are sufficient for many scenarios. I evaluate infrastructure costs in euros per month, including storage, network, and backups, to keep budgets realistic. For clients, I set clear quotas for retention and query limits to ensure fairness and performance. I keep calculations transparent and transfer them to service catalogs so that customers can service packages understand.
I control costs through metric hygiene: I remove unnecessary time series, limit highly variable labels, and scale retention according to usefulness. I track the number of active series per job and client and set alerts when thresholds are exceeded. For storage, I use appropriate classes (fast for operational TSDB, inexpensive for long-term), and I plan network traffic for remote write and reports so there are no surprises.
Future: Managed Services and AI
I see a clear trend toward managed platforms that bundle metrics, logs, and traces under one roof and provide self-service dashboards, enabling teams to act. AI-supported anomaly detection, adaptive thresholds, and automated correlations shorten analysis times. I initially test such functions in secondary paths, compare hit rates, and add them to the alarm concept in measured doses. For inspiration, it's worth taking a look at AI-supported monitoring, which provides ideas on automation, logs, and predictions. Step by step, this creates a monitoring system that prevents failures, optimally sets maintenance windows, and User experience lifts.

Briefly summarized
A cleanly constructed MonitoringThe stack with Prometheus and Grafana gives me a reliable view of infrastructure, workloads, and applications. I collect comprehensive metrics, keep queries fast, and visualize insights so that support and customers can make confident decisions. Alerts are targeted, logs and traces provide context, and rights concepts protect data for each client. With federation, remote write, and recording rules, the system scales without losing response speed. Anyone who wants to run professional hosting and deliver clear SLAs will benefit from this stack in the long term. efficient and transparent.