Skip to content
I will demonstrate specifically how Green Data Center with efficient Cooling, low key figures, and renewable energy hosting. In doing so, I explain why the PUE value hosting Reduces costs, saves CO₂, and enables compliance with future regulations.
Key points
I will briefly summarize the following aspects and highlight the most important ones. Lever out.
- PUE as a key indicator for energy efficiency and cost control
- Cooling through outside air, adiabatic cooling, and liquid techniques
- Waste heat Feed in and supply regional heating networks
- Sustainability Comprehensive: electricity, hardware, location
- regulation As drivers: PUE limits and certifications
Measuring energy efficiency: The PUE value explained
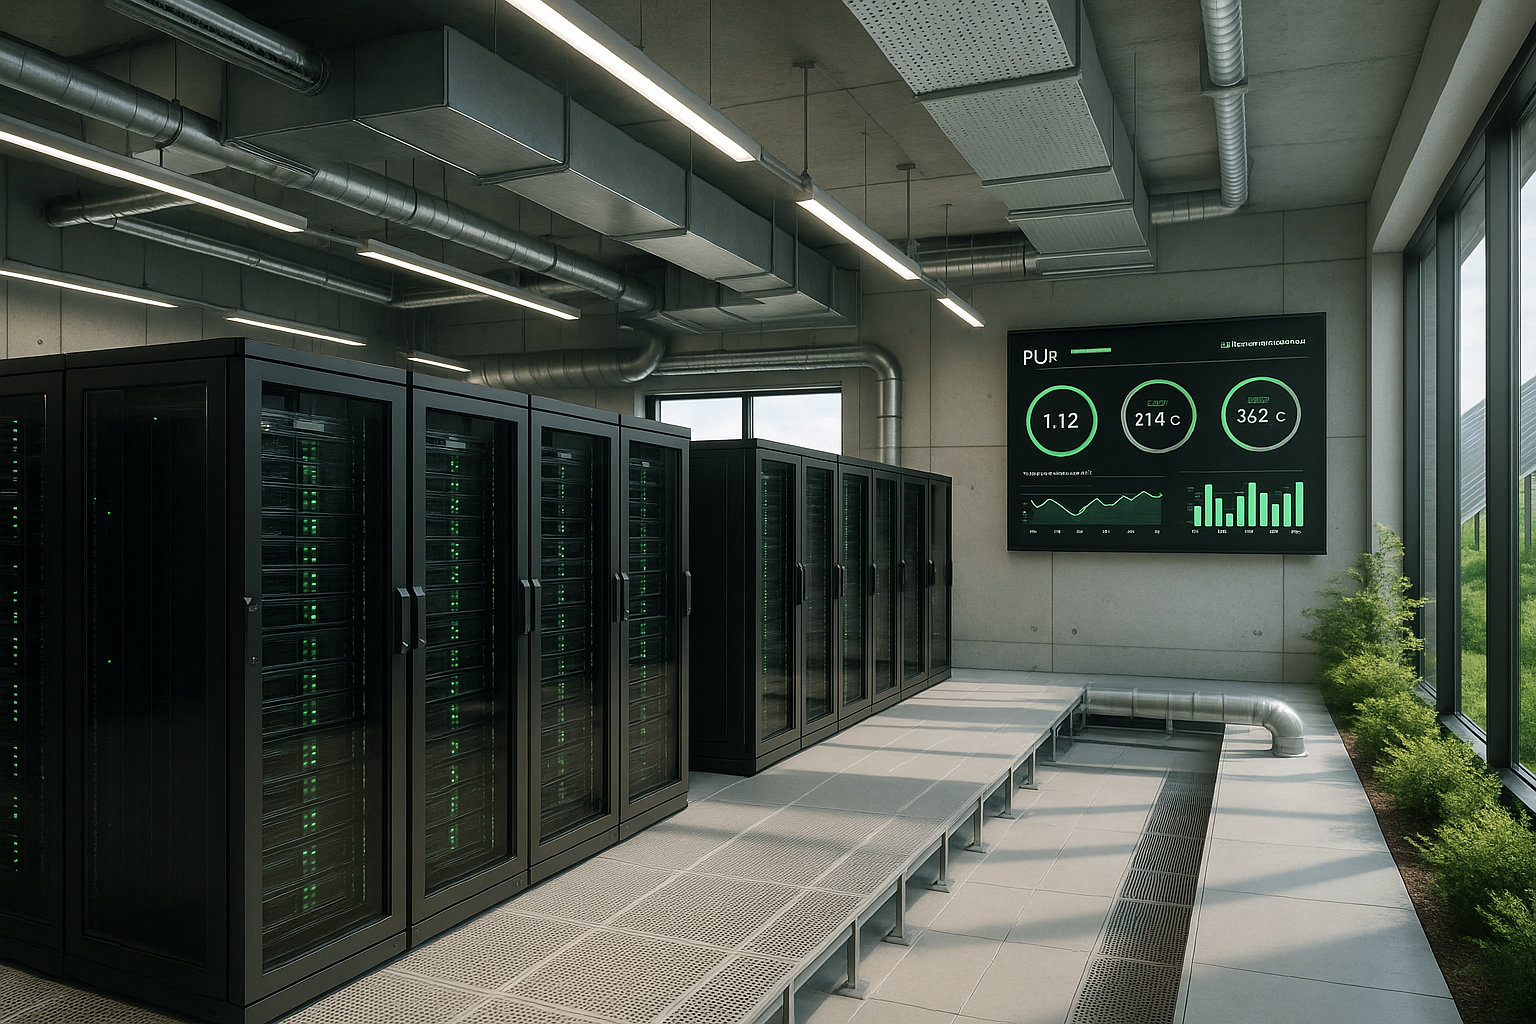
I use the PUE (Power Usage Effectiveness) to compare the total power consumption of a data center with the requirements of the IT hardware. A PUE of 1.0 would be ideal: every kilowatt hour flows into servers, storage, and the network—without any losses due to cooling or conversion. In practice, values below 1.2 are considered very efficient, values above 1.5 are considered good efficiency, and values above 2.0 require optimization [2][4][10]. I focus on five influencing factors: building envelope, cooling concept, utilization, power path, and monitoring. If you want to delve deeper, you can find the basics in the compact PUE value for data centers, which clearly illustrates the effect of individual adjustment screws.
How to measure correctly: methodology, pPUE, and pitfalls
I separate measurement points clearly: main meter at the feed-in point, sub-meter for UPS/distribution, and dedicated measurement of the IT load (e.g., PDUs at rack level). This prevents external loads such as office space or construction cranes from affecting the key figure. In addition, I use pPUE (partial PUE) per hall or module to visualize local optimizations, and ITUE (IT Utilization Effectiveness) to quantify utilization effects. I evaluate PUE on a time-resolved basis (15-minute or hourly intervals) and calculate monthly and annual averages so that seasonality and load profiles do not distort the results.
I address typical sources of error early on: uncalibrated meters, missing reactive power measurement, accumulated redundancy paths, or test runs that are counted as normal operation. A measurement manual and a repeatable procedure (including differentiation between construction and maintenance states) ensure comparability. For stakeholders, I prepare dashboards that show PUE, WUE, and CUE together—including context such as outside temperature, IT load, and free cooling hours.
Cooling: Technologies with leverage effect
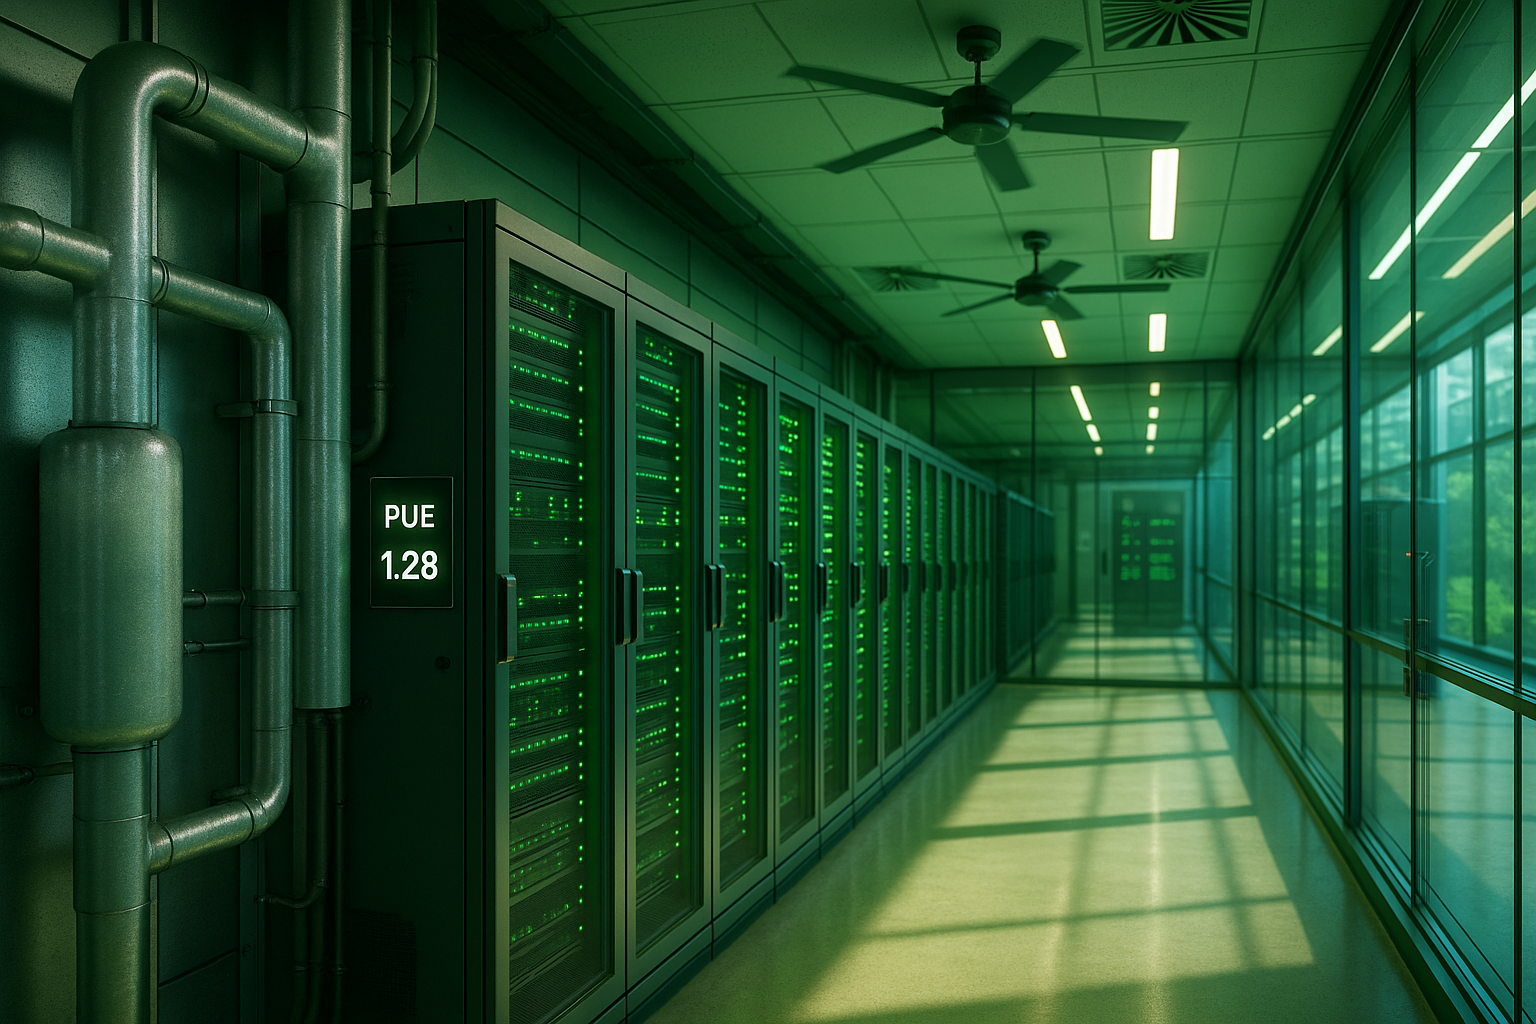
I rely on the Cooling Combinations: Open-air and adiabatic cooling reduce the use of mechanical cooling, while liquid cooling dissipates hotspots directly at the chip. Hot and cold aisle containment prevents air mixing and reduces the amount of air required. Intelligent control adjusts air volume, temperature, and pump capacity to the load in real time. In suitable climate zones, I can often manage without compression cooling for 70–90 percent of the year. Examples show that operators achieve very low PUE values with outside air, liquid technologies, and heat recovery [1][5][7].

High-density workloads: Efficient cooling of GPUs
With AI and HPC workloads, racks increase from 10–15 kW to 30–80 kW and above. I therefore plan early for rear door heat exchanger (Rear-Door HX), direct Chip liquid cooling (direct-to-chip) or Immersion, depending on density, maintenance concept, and budget. I supplement air-cooled rooms with liquid circuits (secondary side) in a modular fashion and prepare flow temperatures of 30–45 °C to enable efficient dry coolers and heat recovery. Tight pipe routing, drip tray protection, leak monitoring, and service access are important to ensure operational safety and efficiency go hand in hand.
I adapt control strategies to the dynamics of GPU loads: limiting ramps, decoupling pumps/fans, and utilizing thermal headroom. This allows me to avoid oscillations and make maximum use of free cooling. Where possible, I raise the server supply air temperature in line with ASHRAE recommendations – this measurably reduces fan work without shortening service life.
Utilizing waste heat: Heat as a product
I consider Waste heat as usable energy and connected it to local heating networks wherever possible. This means that IT waste heat replaces gas or oil heating in neighborhoods and reduces emissions. Technically, I use temperature levels of 30–50 °C directly or raise them with heat pumps. This integration reduces the region's overall energy requirements and improves the data center's overall balance sheet. Municipal partnerships create a reliable customer for year-round heat quantities [1][5].
Business models for heat: technology, contracts, returns
I calculate three basic paths: direct feed-in to an existing network, establishment of a neighborhood network, or bilateral heat contracting with individual customers (e.g., swimming pools, greenhouses). CAPEX arises from heat exchangers, pumps, pipes, and, if applicable,. heat pumps to raise the temperature. OPEX decreases when the heat pump operates at a low flow temperature and defrost cycles are minimized. I secure purchase and pricing formulas in long-term contracts (heat quantities, availability, indexing) so that the business case pays off over 10–15 years.
In my planning, I take into account redundancies, Legionella prevention, network hydraulics, and seasonal storage (buffer storage, geothermal probes). This makes waste heat calculable—and a second product alongside IT services.
Sustainability in hosting: Selection criteria for providers
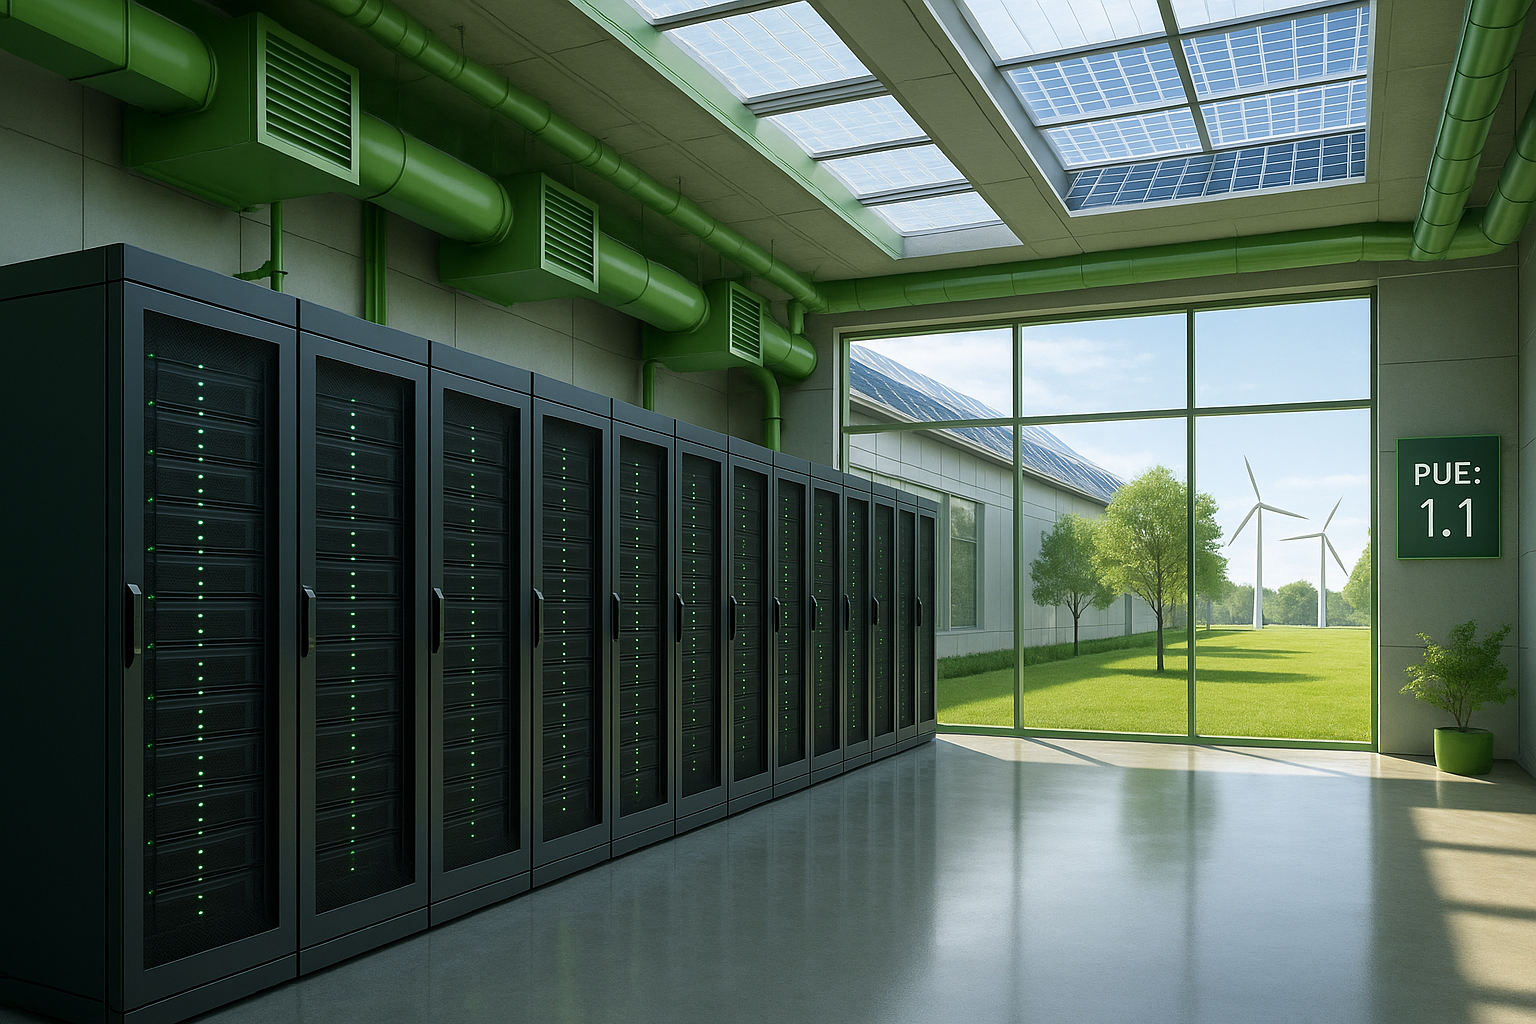
When it comes to hosting offers, I pay attention to Green electricity with certification, low PUE values, efficient hardware, and a transparent carbon footprint. I also check the location, mobility concept, and greening, because short distances and a good microclimate further reduce energy consumption. If you want to get started quickly, refer to the compact guide to Green Hosting. I also pay attention to reports on utilization: highly utilized servers deliver more workload per kilowatt hour. This allows me to combine economic efficiency with real climate benefits.
Electricity procurement and grid serviceability
I integrate simultaneous procurement renewable energy, where possible: PPAs, direct deliveries, or regional models with hourly balancing. This reduces CUE and increases the system effect compared to pure guarantees of origin. I use UPS systems and battery storage for Peak shaving and demand response without compromising availability—clear boundaries, tests, and SLAs are essential for this. I am switching emergency power solutions to HVO or other synthetic fuels and limiting test runs. The result is a load profile that supports rather than burdens the grid.
Legal requirements and certifications
I direct my Planning clear limits: In Germany, existing data centers will be subject to a maximum PUE of 1.5 from mid-2027 and 1.3 from 2030; for new buildings, these limits will apply earlier [6]. This increases the pressure to invest in cooling, power paths, and control systems. I use ISO/IEC 30134-2 and EN 50600-4-2 for key figures, as well as LEED and the EU Code of Conduct for construction and operation as guidelines. These frameworks facilitate tenders and give customers confidence. A low PUE thus becomes a competitive advantage—especially in hosting.
Transparency, reporting, and governance
I embed efficiency in processes: energy targets in OKRs, monthly reviews, change management with efficiency checks, and playbooks for maintenance in partial load operation. Customers receive self-service dashboards with PUE/CUE/WUE, utilization, energy sources, and waste heat quantities. For audits, I document measurement chains, calibration plans, and demarcations. Training courses (e.g., for data center operations, network teams, DevOps) ensure that efficiency is practiced in day-to-day business—for example, through right-sizing of VMs, automatic shutdown of staging environments, or night profiles.
Key figures beyond PUE: CUE and WUE
In addition to the PUE I assess the climate impact using CUE (carbon usage effectiveness) and water consumption using WUE (water usage effectiveness). This allows me to determine where the electricity comes from and how much water is used for cooling. A very low PUE only has an effect if the electricity is renewable and water consumption is kept under control. Operators who feed in waste heat further reduce system emissions. Key performance indicators make progress measurable and comparable [2].

Resource conservation and circular economy
I obtain Scope 3 emissions Hardware: Durable designs, reuse, refurbishment, and component-by-component upgrades (RAM/SSD) reduce material usage. Lifecycle analyses help to determine the optimal replacement time—often, a targeted refresh is more efficient than operating severely outdated systems. I minimize packaging through consolidated deliveries and send old equipment to certified recycling facilities. I also take construction resources (concrete, steel) into account by revitalizing existing buildings and using modular extensions instead of new construction on greenfield sites.
Practice: Reducing PUE in your own stack
I start with quick wins: Raise the temperature in the computer room (e.g., 24–27 °C), close the hot/cold aisle enclosure, and seal any leaks. I then optimize air volumes, fan curves, and power paths, for example, by using highly efficient UPSs with low conversion losses. On the server side, I consolidate workloads, activate energy-saving modes, and remove old devices with poor efficiency. I continuously measure improvements using DCIM and energy meters per circuit. This reduces the PUE step by step—visible in monthly reports.
Roadmap: 90 days, 12 months, 36 months
In 90 days, I will complete enclosures, adjust temperature/setpoints, update fan curves, and introduce measurement and reporting standards. In 12 months, I will modernize the UPS/cold chain, balance loads, consolidate servers, and establish waste heat pilot projects. In 36 months, I will scale liquid cooling, conclude PPAs, expand heating networks, and optimize the site (e.g., second feed-in, PV/carrier networks). Each phase delivers measurable savings without compromising availability.
Costs and business case: Data center and hosting
I count the Return For example: With an annual consumption of 5,000,000 kWh and an electricity price of €0.22 per kWh, 0.1 PUE points generate around €100,000 per year in energy costs for non-IT consumption. If I reduce the PUE from 1.5 to 1.3, for example, I reduce these ancillary costs by approximately €200,000 per year. At the same time, IT utilization increases because cooling and power reserves grow. For hosting customers, this has an impact on prices, service levels, and carbon footprint. This allows efficiency to be directly translated into euros and CO₂.
Risks and trade-offs: Availability meets efficiency
I keep redundancy (N+1, 2N) efficient by minimizing partial load losses: UPSs with high efficiency of 20–40 % load, modular chillers, speed-controlled pumps/fans, and optimized bypass concepts. I schedule maintenance during cool times of the day to maintain free cooling ratios. I minimize water consumption through adiabatic systems with recirculation, water quality management, and fallback-capable dry cooling. In regions with water shortages, I prefer air-based concepts or direct liquid cooling with closed circuits.
Site selection and architecture: Efficiency right from the start
I choose Locations with cool outside air, good grid connection, and the possibility of waste heat feed-in. An efficient building envelope, short air paths, modular technical areas, and green roofs add additional percentage points. Proximity to renewable energies reduces transmission losses and improves the carbon footprint. Existing industrial sites with existing infrastructure save construction resources and speed up approvals. In this way, the location decision has an impact on OPEX and emissions for years to come.
Comparison of selected providers
I use tables to Features present information in a compact manner and speed up the selection process.
| Provider | PUE value | Energy source | Special features |
|---|---|---|---|
| webhoster.de | 1,2 | 100% Renewable | Test winner hosting |
| LEW Green Data | approx. 1.2 | 100% Renewable | Waste heat utilization |
| Green Cloud | 1,3 | wind power | Wind turbine base |
| Hetzner | 1,1 | 100% Green electricity | State-of-the-art technology |
I rate PUE, the origin of the electricity, and options for heat recovery together, because this combination accurately reflects the climate impact.
Outlook: The data center of tomorrow
I expect Automation AI-supported control, adaptive cooling with minimal water consumption, and consistent heat recovery in neighborhoods. Data centers are being built closer to renewable energy producers or in existing buildings to save space and resources [3]. Decentralized concepts shorten distances, relieve pressure on networks, and distribute waste heat locally. If you want a compact overview of trends, you will find inspiration at Green Data Center Trends. This means that the digital footprint grows while energy consumption and carbon emissions decrease measurably.
In short: My summary
I focus on PUE as a key indicator because it combines energy, costs, and regulation. Efficient cooling, renewable electricity, and waste heat utilization reduce consumption and CO₂ emissions at the same time. CUE and WUE complete the picture, ensuring that efficiency does not come at the expense of climate impact or water. Clear limits increase the incentive to adapt technology and operations quickly. Anyone booking hosting should check PUE, electricity source, utilization, and heat utilization—this is how technology becomes truly sustainable.