 Skip to content
Green data centers are coming into focus because of efficiency, cooling and PUE. I show how green datacenter hosting becomes a sustainable hosting future through smart cooling concepts, renewable energy and consistent measurement with the PUE value.
Key points
I summarize the most important aspects of efficiency, cooling, PUE and future-proofing. These key points help me to make decisions for sustainable Hosting to make well-founded decisions.
- PUE valueKey figure for energy efficiency, target close to 1.0
- CoolingFree cooling, water cooling, heat recovery
- Green electricity: 100 % renewable energy and transparency
- CertificatesISO 50001, ISO 27001, ISO 14001
- AI controlLoad management and predictive maintenance
The list serves as a quick orientation and sets clear Priorities. I evaluate providers according to measurable key figures rather than marketing promises. The decisive factors are real efficiency gains and comprehensible Reports. I derive costs, risks and climate benefits from this. If you take these points into account, you can make reliable decisions.
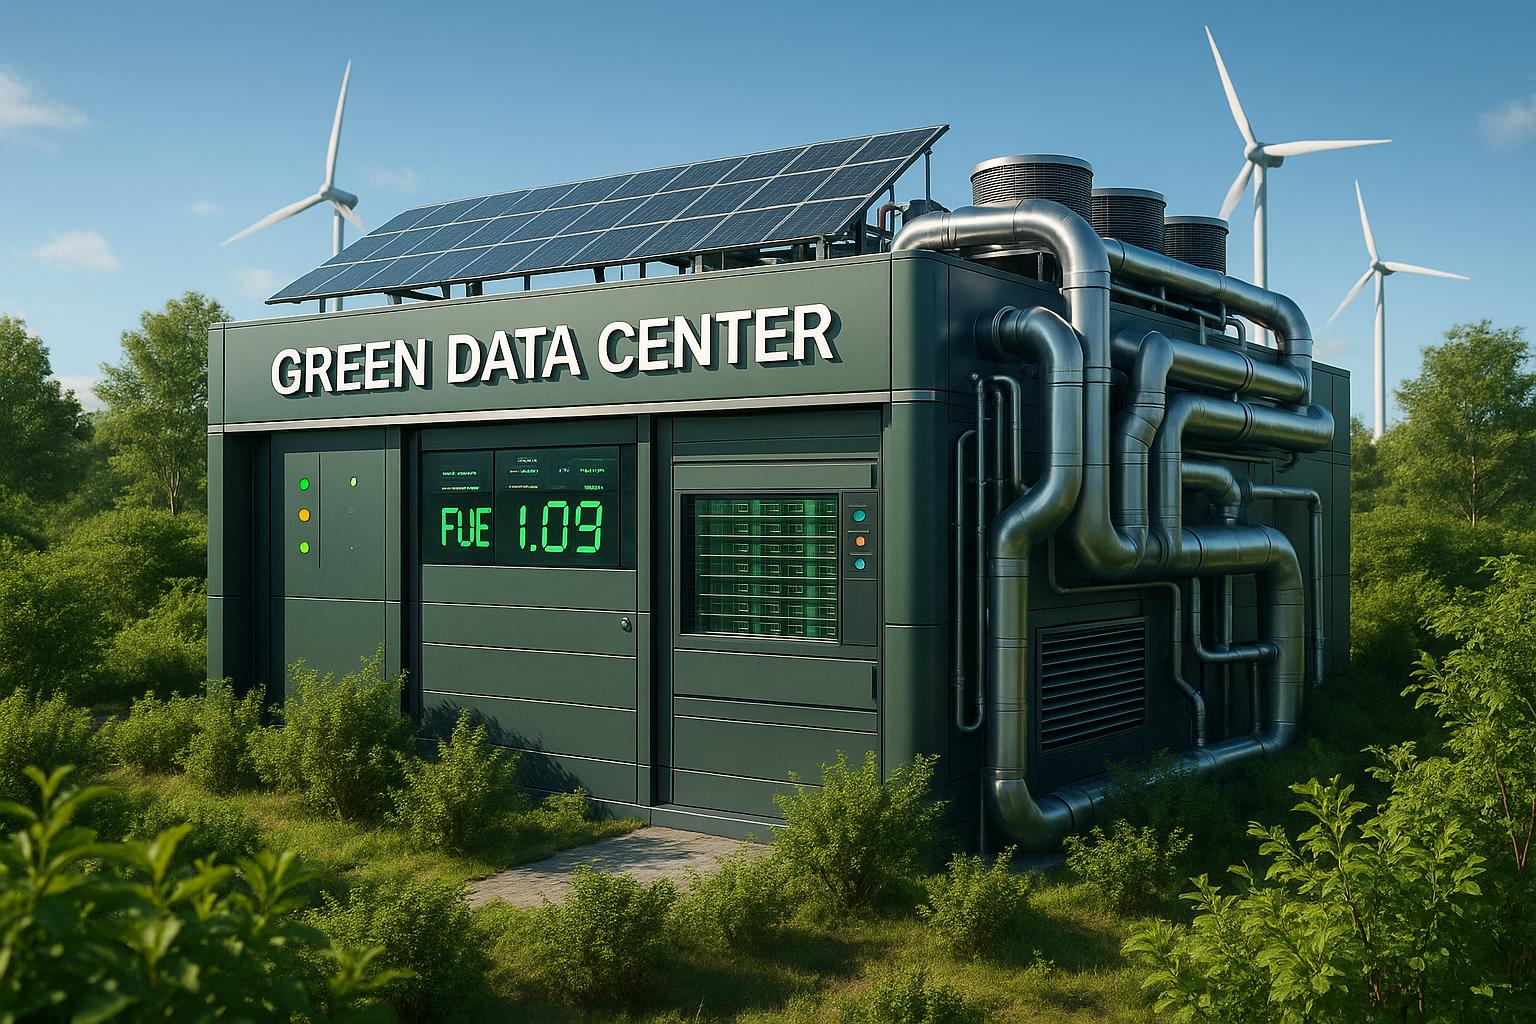
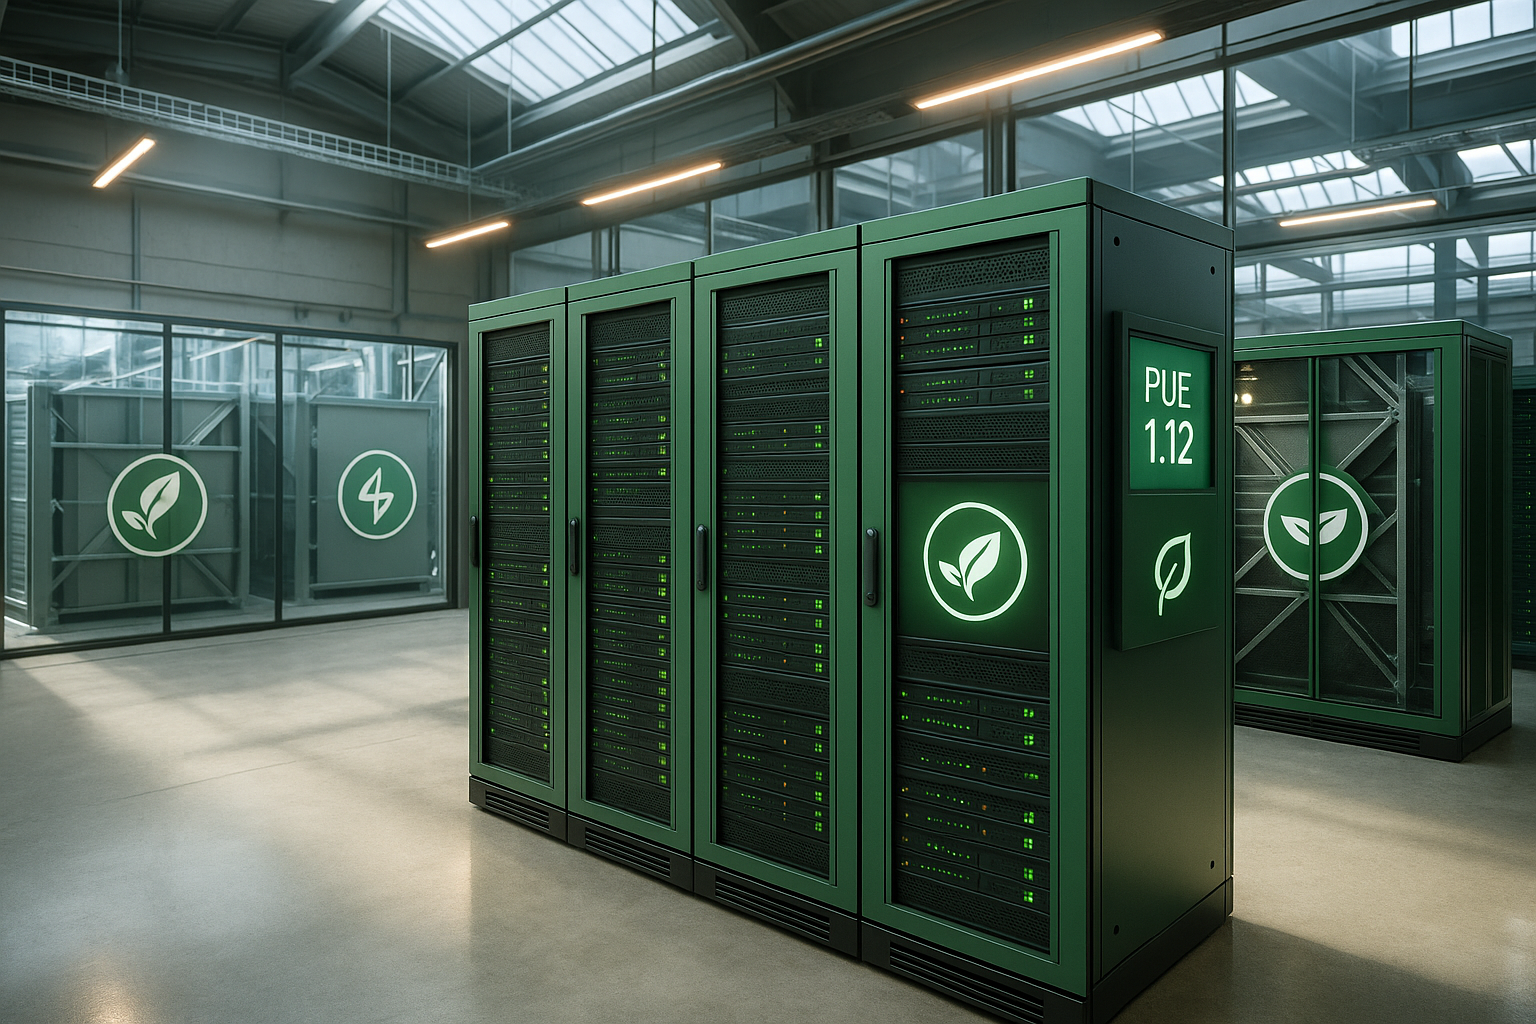
What does a Green Data Center actually mean?
A green data center reduces energy consumption and CO₂ emissions by 100 % Green electricity, efficient server technology and intelligent cooling [1][3][5]. I check whether the operator transparently identifies and reliably certifies the origin of the energy. It is also important to have a modern UPS, short energy paths and consistent utilization control of the Hardware. Providers embed sustainability in procurement, operation, maintenance and recycling. The result is a data center that delivers performance and reduces emissions at the same time.
I pay attention to the service life of the systems, reparability and the plan for spare parts. Real savings are made when operators don't replace devices too quickly, but instead use them sensibly. modernize. Virtualization and consolidation increase capacity utilization, which reduces the power requirement per service. Documented audits create trust because figures and measures become comprehensible. This transparency is essential for well-founded decisions [1][3][7].
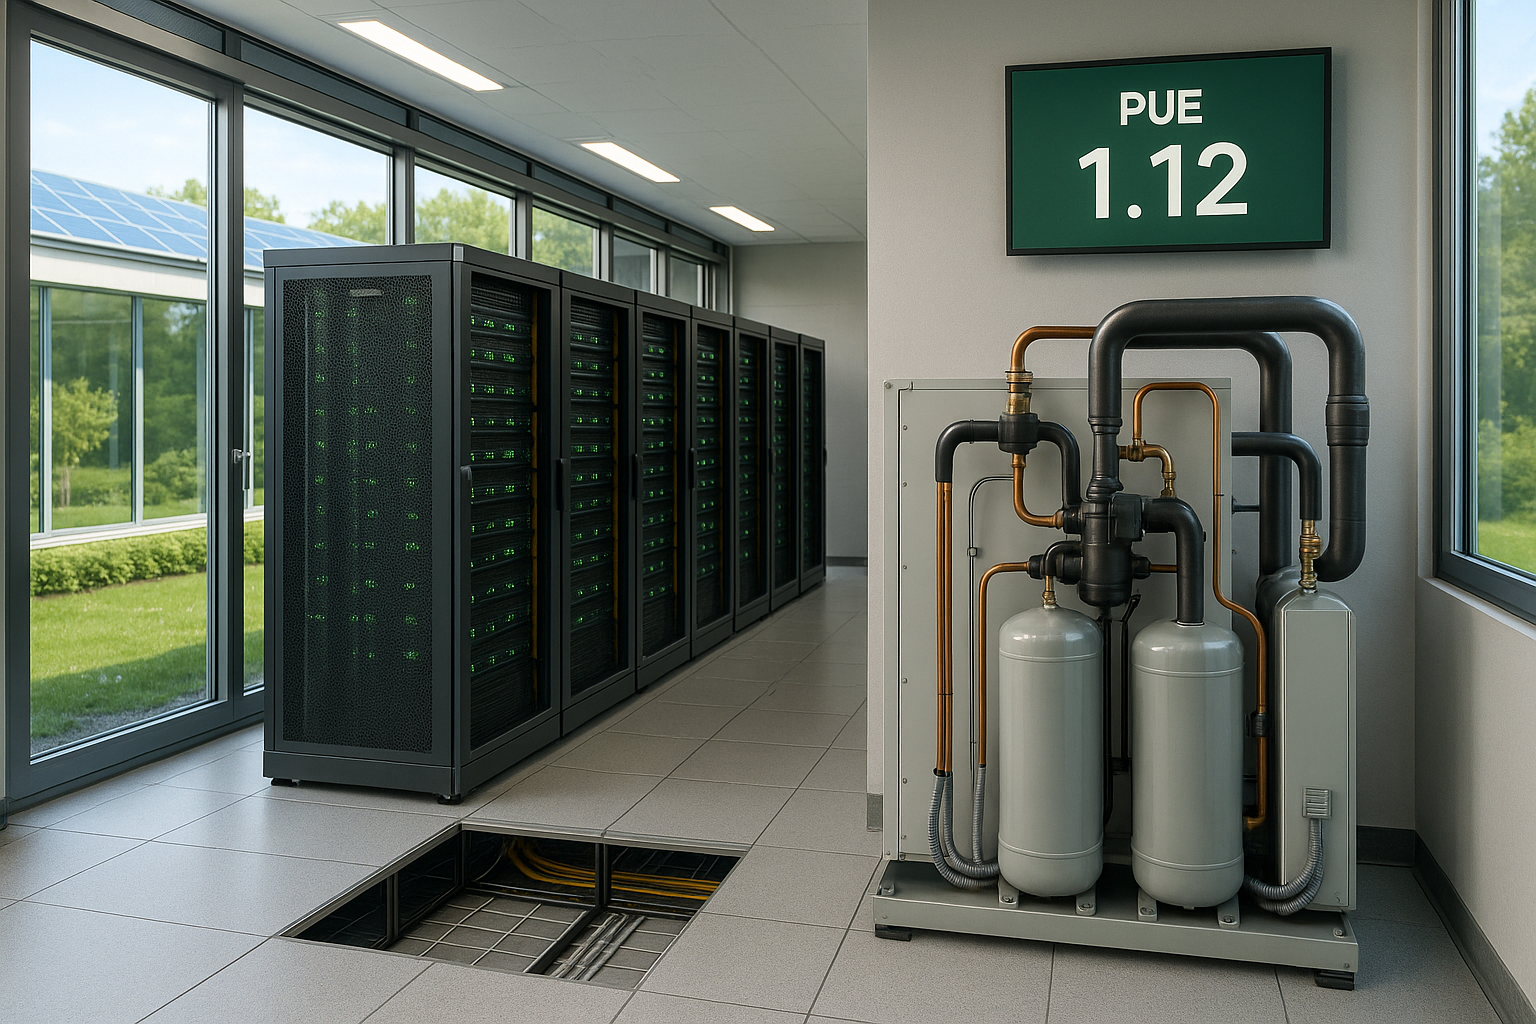
PUE value explained: key figure with effect
The PUE value (Power Usage Effectiveness) is the ratio of the total energy consumption of a data center to the energy required to operate it. IT equipment. The closer the value is to 1.0, the less energy flows into cooling, UPS and auxiliary systems [2][4][6][10]. In practice, PUEs of 1.08-1.20 are regarded as peak values, 1.3-1.5 as very good, 1.6-2.0 as standard and over 2.5 as outdated [4][8]. This metric helps me to compare providers objectively and evaluate real operating costs. If you take pue wert hosting seriously, you gain efficiency and reduce emissions.
I never interpret PUE in isolation, but together with site climate, capacity utilization and cooling strategy. A modern building in a cooler region often achieves better PUE-values than a hot location. This also includes measurement methodology, annual averages and transparency over partial load. If you want to delve deeper, you can find background information in the article PUE value for data centers. So I make decisions based on reliable data instead of gut feeling.

Cooling: from free cooling to heat recovery
Cooling accounts for a large proportion of the energy requirements of a data center. Free cooling uses cool outside air, reduces chiller running times and therefore electricity costs [1][4][9]. Direct or indirect outside air systems reduce the cost of compressors and pumps. In computer rooms with hot/cold aisle containment, operators avoid uncontrolled air mixing. This increases efficiency and stabilizes the Temperature.
Water cooling efficiently absorbs high heat loads and enables narrower temperature windows. Operators feed waste heat back into heating systems or districts via heat exchangers. This creates a second useful flow that replaces fossil fuels. AI-supported control adjusts the cooling capacity to the actual load and smoothes out peaks. This combination noticeably reduces PUE and makes operation future-proof [1][4][9].
More than PUE: WUE, CUE and ERE at a glance
For a complete picture, I look at additional key figures: WUE (Water Usage Effectiveness) describes the water consumption per IT service delivered. A low WUE is particularly important in water-scarce regions because it conserves resources and reduces cost risks. The CUE (Carbon Usage Effectiveness) links the electricity mix and efficiency to a CO₂ figure per IT energy. It helps me to recognize whether low PUE values actually lead to lower emissions. The ERE (Energy Reuse Effectiveness) shows how much energy can be sensibly used as Waste heat is used. Taken together, these metrics provide a realistic sustainability profile that usefully complements the PUE [1][3][7].
I therefore request WUE, CUE and ERE values at the same intervals as PUE reports - with a clear methodology and annual averages. Operators that feed waste heat into local grids reduce their effective energy footprint and improve their ERE. Where water consumption is relevant, I prefer indirect systems or circuits with high water reuse. In this way, I not only evaluate efficiency in the data center, but also the impact on Environment and municipality.
High-density workloads and liquid cooling
With AI and GPU workloads, the power densities per rack increase to 30-80 kW. Air cooling quickly reaches its limits here. I therefore plan early on with direct-to-chip or immersion cooling and rear-door heat exchangers. Liquid cooling transports heat closer to the source and reduces fan work. This enables higher inlet temperatures and saves compression work. At the same time, setpoints in the computing space can be raised, which reduces the Free cooling extended and PUE improved [1][4][9].
In mixed environments, I combine zones with air and liquid cooling. Consistent sensor technology, defined temperature windows and redundancy concepts that match the density are important. I take material compatibility, leakage monitoring and maintainability into account. The aim is a scalable layout that accommodates increasing densities without forcing conversions to the floor plan. This keeps costs calculable, while the platform for new Workloads is prepared.
Location, certificates and transparency
A sensible location reduces energy consumption through moderate Climate and short grid connections. I check whether 100 % green electricity is credibly documented and whether certifications such as ISO 50001, ISO 27001 and ISO 14001 are available. These standards document energy and information security management as well as environmental processes. Equally important are reports on CO₂ compensation and local heat use. For an overview, the article on Green Hosting, which summarizes the key test points.
Transparency means: real measured values, evidence and regular Audits instead of vague statements. I also compare the spare parts strategy and the rate of repaired rather than replaced components. This reduces electronic waste and saves resources over the entire life cycle. Operators with open reporting create trust and promote well-founded purchasing decisions. This allows sustainability to be assessed objectively [1][3][7].
Measurement strategy: submetering and data quality
Good decisions need good data. I demand submetering for IT load, cooling circuits, fans, pumps and UPS losses. I pay attention to calibrated meters, clear measuring points and consistent time resolution. I record PUE, WUE and CUE as monthly and annual values, supplemented by load band analyses. This allows me to see how efficiency behaves at 30 %, 50 % and 80 % utilization. I recognize deviations early on when measured values and telemetry from Facility and IT correlate.
I establish regular calibrations and plausibility checks. A defined change process ensures that modifications or firmware updates do not lead to measurement errors. Continuous commissioning makes efficiency an ongoing process rather than a one-off exercise. This discipline prevents whitewashing and provides the basis for reliable Reports [2][6][10].
Measures for sustainable and future-proof hosting
The sum of many counts for real progress Steps. Operators use certified green electricity from wind, water or solar and thus avoid direct emissions [1][3][5][7]. CO₂ compensation can offset residual quantities, for example via projects or municipal heat utilization. Durable hardware, repair concepts and modular systems save material and reduce the risk of failure. Virtualization, containers and workload automation increase server utilization and reduce idle time.
I pay attention to continuous modernization instead of large, infrequent leaps. In this way, efficiency gains are promptly transferred to the Operation. Monitoring with clear KPIs creates an early warning system for energy and availability. The interplay of technology, processes and reporting brings tangible savings. This creates a solid foundation for sustainable growth.
Software and architecture levers: getting efficiency out of the stack
Sustainability starts in the code. I check workloads for efficiency: caching, database indexes, asynchronous processing and adapted runtime versions reduce CPU time. Right sizing and autoscaling avoid idle time. Container limits, sleep states and power-aware scheduling save watts without increasing the CPU load. Performance at risk. Content optimization, CDNs and edge caching reduce data transfers and server load.
At hardware level, energy-efficient architectures such as ARM servers or accelerator-friendly nodes can increase throughput per kWh. I promote consolidation instead of uncontrolled growth: fewer, but well-utilized hosts reduce overhead. Transparent metrics such as requests per kWh or jobs per kWh make efficiency tangible for development teams. In this way, software optimization and data centre operation merge into a real Lever [2][6][10].
Procurement, life cycle and Scope 3 emissions
In addition to operation, gray energy in production and logistics also counts. I take Scope 3 emissions into account in procurement decisions and give preference to durable, repairable systems. Refurbishment, second-life use and take-back programs reduce electronic waste. Clean documentation of components makes maintenance easier and extends their service life. This is how I reduce the ecological footprint per service over the entire life cycle. Life cycle.
In TCO considerations, CO₂ is given a price - as shadow costs or in the form of premium-based targets. This changes priorities: It's not the cheapest path that wins, but the most effective one. I demand proof of supply chain standards, environmental labels and reparability. Where possible, I use modular upgrades instead of complete replacements. This keeps budgets predictable and makes sustainability measurably visible [1][3][7].
Provider overview: Table and classification
The following table shows typical key figures for sustainable Provider. I pay attention to PUE, energy source, certificates and special efficiency features. Values can fluctuate depending on capacity utilization, time of year and location, so I check methods and measurement periods. What counts for selection decisions is the combination of efficiency and reliability in the Daily operation. This creates a realistic picture of strengths and priorities.
| Provider | PUE value | Energy source | ISO certifications | Special features |
|---|---|---|---|---|
| webhoster.de | 1,2 | 100 % Green electricity | ISO 50001, ISO 27001 | Market leader, WordPress-optimized |
| Example A | 1,4 | Hydropower | ISO 50001 | Own heat recovery |
| Example B | 1,5 | Wind & Solar | ISO 14001 | Several locations in DE |
In tests, providers with very low PUE, modern facility management and transparent sustainability reports. Offering this combination reduces operating costs and increases availability. I also take service quality and scalability into account. The overall result is what counts, not an isolated individual figure. On this basis, the choice is usually clear [4][8].

Contracts, KPIs and green SLAs
Sustainability belongs in the contract. I anchor target corridors for PUE, WUE and CUE, which location- and seasonally appropriate. Guarantees of origin for green electricity, audit cycles and reporting formats (e.g. monthly raw data) are recorded. Bonus-malus regulations create incentives to exceed efficiency targets. Equally important: defined key figures for Waste heat-minimum temperatures for return flow and transparency regarding downtimes of heating networks.
I prefer providers with API access to energy and utilization data so that finance, operations and ESG reporting use the same source. Clear escalation paths if targets are missed, including an action plan, prevent discussions in an emergency. In this way, sustainability does not become a side issue, but a binding component of the Service description.
Economic effects: Reduce costs, secure performance
A low PUE reduces the ancillary costs per utilized kWh. These savings are reflected directly in TCO and OPEX calculations. I see energy-efficient operation as a clear competitive advantage. Lower peak loads take the strain off the infrastructure and reduce the risk of downtime. This results in predictable costs and stable Performance over the life cycle.
Transparent key figures facilitate budgeting and contract design. Energy prices remain volatile, efficiency dampens the effect on the hosting bill in euros. The relevance of ESG requirements in tenders is also growing. Those who work demonstrably efficiently win projects and trust. This makes energy efficiency an economic lever of the first order.
Risk and network strategy: resilience meets efficiency
Sustainability and availability are not mutually exclusive. I plan redundancy in such a way that it is targeted: N+1 instead of 2N, where appropriate, and adaptive load sharing between zones. Demand response capability and intermediate storage help to avoid expensive grid peaks and renewable generation better. Prepared operating modes for heat waves or cold periods ensure stability without permanently sacrificing efficiency.
Site selection takes into account grid quality, feed-in options for waste heat and risks from extreme weather conditions. A robust spare parts and service chain reduces mean time to repair. I regularly test emergency procedures to ensure that processes are effective in an emergency. The result is an architecture that remains economical and confidently meets regulatory requirements in the future [1][3][7].
Technical practice: Server hardware, UPS and monitoring
I rely on the latest processors with high efficiency per Watt and RAM/storage concepts that realistically map load profiles. Hot/cold swapping and predictive maintenance reduce downtimes. A modern, low-loss UPS with high partial load efficiency saves measurable power. Direct current paths or optimized alternating current topologies reduce further losses. Densely packed racks require a cleanly planned air or power supply. Watermanagement.
Monitoring provides the data basis for quick corrections. I link telemetry from IT, facility and energy meters. AI models detect anomalies at an early stage and suggest targeted measures. This allows me to react to deviations before they affect costs or availability. The result: stable operation with lower energy consumption [2][6][10].

Checklist: Questions for choosing a provider
- What are the PUE, WUE, CUE and ERE on an annual average and at partial load?
- Which measuring points and meter classes are used and how often are they calibrated?
- Is 100 % Green electricity documented with proof of origin, are there PPAs?
- Which cooling strategy (air, direct-to-chip, immersion cooling) is used and how is waste heat utilized?
- Which ISO certifications are active and when was the last audit?
- How high is the repair rate compared to hardware replacement? Are there take-back programs?
- Which data APIs and report formats are available for ESG and finance?
- How is high-density (GPU) scaled, which kW/rack are available?
- Which green SLAs (target corridors, bonus/malus) are contractually fixed?
- What is the roadmap for further increasing efficiency over the next 24 months?
Looking ahead: AI, flexibility and regulation
The next stage is emerging from AI-supported energy optimization, local Generation and better storage facilities. I expect edge locations that systematically use waste heat and integrate it regionally. Power-purchase agreements and onsite generation create price security. Mature automation combines workloads with favorable energy windows. I provide an overview of trends in the article Web hosting trends 2025, that combines innovation and sustainability.
Increasing regulation demands transparency regarding energy, emissions and Waste heat. It pays to act early because processes, measurements and reports take time. Those who set up their infrastructure efficiently today will also be able to cope with stricter requirements tomorrow. I therefore plan investments in such a way that they support audit and reporting obligations in the long term. This protects budgets and strengthens your competitive position.
Summary: Climate benefits and digital sovereignty
Green Data Centers bring measurable efficiency gains and reduce emissions. The PUE value provides me with a clear key figure to compare offers fairly. Intelligent cooling, renewable energy and consistent monitoring result in a reliable combination. Companies gain predictability, cost benefits and a credible sustainability profile. In this way, green datacenter hosting creates a digital future that conserves resources and enables growth.
I am committed to transparency, certified energy sources and reliable Data. This results in decisions that take equal account of technology, economy and climate. Switching today reduces risks and increases availability. The result is a hosting setup that delivers performance and takes responsibility. This is exactly what I expect from modern infrastructure [1][3][7].


