Skip to content
With the lighthouse page analysis, I check the loading times, interaction and visual calmness of your website directly in the browser and determine optimization priorities based on the noticeable effect on users and sales. This allows you to see which hosting factors, scripts and media are slowing down performance and how you can tackle them in a targeted manner.
Key points
The following points show you the common thread for effective analysis and optimization.
- Metrics understand: Correctly interpret LCP, TBT, CLS and set priorities.
- Hosting check: Use server response, CDN and HTTP/2 sensibly.
- Assets streamline: compress images, minimize CSS/JS, lazy loading.
- WordPress streamline: Clean up plugins, configure caching properly.
- Continuity secure: Repeat audits, document progress.

What is Lighthouse - and why is it particularly important for hosting customers?
Google Lighthouse provides me with a structured Analyze your site and evaluate performance, SEO, accessibility and best practices in a report with a score. I can see at a glance whether server responses are taking too long, whether images are too large or whether scripts are blocking the main time. For hosting customers, the tool shows how tariff, configuration and caching affect real user impact. I don't just see symptoms, but the real cause behind a low score and can take targeted action. This diagnosis makes all the difference, especially for stores, booking systems or lead pages, because every delay demonstrably costs conversion and the Visibility in search engines.
The most important Lighthouse metrics explained clearly
LCP describes the time until the largest content element becomes visible and counts heavily in the performance score, so I treat it as a Top destination. TBT adds up all the blocking times of the main thread and shows me how much JavaScript delays the interaction. FCP and Speed Index reveal how early users perceive content and how fluid the structure appears. CLS measures layout jumps and motivates me to set image and video placeholders so that the page remains smooth. With TTI, I can recognize when the page is really usable, which helps me with more complex frontends in particular. Priorities for code changes.

Lab data vs. field data: How to compensate for differences
Lighthouse measures in Laboratory with defined framework conditions. Real user data (field data/core web vitals), on the other hand, shows how your site behaves in everyday life across many devices, networks and locations. I compare both in order to make decisions reliable. If the lab looks good but the field data is weak, the cause is often fluctuating network quality, slow devices or regional latency.
- URL vs. origin level: I specifically check important URLs (start page, product page, checkout). A good Origin tool can cover up weaknesses in individual templates.
- 28-day window: Field data smoothes outliers. I plan optimizations in advance and test the effect not just once, but over several weeks.
- Device mix: Many users are on the move. I therefore give LCP/TBT a higher weighting for mobile and test with throttling and realistic viewports.
- Close the gap: I simulate problematic cases (low-end CPU, 3G/4G) in the lab until the lab and field data paint a coherent picture.
Starting Lighthouse: how to run the audit correctly
I open the page in Chrome, call up the DevTools and select the Lighthouse tab, then I specify mobile or desktop and start the report with a Click. Before the audit, I close unnecessary browser tabs to avoid interference and repeat the measurement several times so that outliers do not distort the impression. For mobile analyses, I take CPU throttling and network simulation particularly seriously because they better reflect real-world conditions. After the run, I see the scores and a prioritized catalog of recommended actions, which I work through from top to bottom. For more in-depth checks, I include a WordPress performance audit if the site is based on a CMS and many plugins are integrated.
Measurement setup and reproducibility
Clean measurements save time because they avoid discussions about "felt faster". I document my setup and keep it constant for comparative measurements. This allows me to recognize real progress and not measurement artefacts.
- Define cache state: One run with a warm cache (page, object, CDN cache) and one run cold. This is how I isolate server effects from caching effects.
- Choice of location: I evaluate latencies from relevant regions. For international projects, I simulate test points with a higher RTT.
- Consents/Flicker: Cookie banners and consent modals influence TBT/CLS. I measure both states (before/after consent) separately.
- Comparability: Same URL, same viewport, same throttling profiles. I note changes to the build (minifier, bundler) in the changelog.
Typical brakes and what I do about them
If I notice long server response times, I check the tariff, PHP version, database latency and activate OPCache, because these adjustments immediately save time and improve the Answer accelerate. I convert large images to WebP format, reduce dimensions to the real display size and activate lazy loading for media placed below the fold. In JavaScript, I identify expensive tasks, load libraries with defer or async and remove unused modules to significantly reduce TBT. I streamline CSS through minification and critical inline CSS for the above-the-fold area so that initial content appears immediately. To avoid layout jumps, I reserve heights and widths for images, ads and embeds, so that the page remains smooth when loading and the CLS-value decreases.

Third-party scripts under control
Tracking, ads, chat widgets and A/B tools are often the biggest TBT and LCP killers. I prioritize what's really business critical and offload the rest later or conditional.
- Asynchronous & decoupled: Avoid tags and pixels with async/defer, late initialization after first interaction and hard blocking.
- Consent-based: Load scripts only after consent. This reduces rendering and execution time for users without consent.
- Self-Hosting: Provide critical libraries (e.g. small helpers) locally to save DNS lookups and third-party latencies.
- Resource Hints: For unavoidable third parties, I carefully set preconnect/dns-prefetch so that connections are established earlier.
- Lazy Third-Parties: Load widgets only on visual contact or on intent (e.g. click on "Open chat").
Fine-tune the render path: Fonts, preload and hints
Many milliseconds lie in the Small print of the render path. I make sure that the browser knows important resources early on and that blocking factors disappear.
- Fonts: Subsetting, local hosting, font-display: swap and preload for the primary font. This keeps the text visible quickly.
- Hero elements: Preload the LCP image specifically and provide it in a suitable size. Do not lift oversized files above the fold.
- Critical CSS: Above-the-fold CSS inline, load the rest decentrally. I consistently avoid CSS blocking.
- Modular JS: Code splitting, only required modules per page. Hydration only when really necessary.
Accelerate WordPress in a targeted manner
In WordPress, I often find too many plugins, old themes or uncompressed images that lower the score and make real Users frustrate me. I start with a plugin review, remove duplications and consistently update remaining extensions. I set up caching clearly at page, object and browser level and ensure compatible rules for logged-in users. I optimize images before uploading and generate thumbnails in the sizes actually used so that no oversized assets end up in the frontend. If you also want to measure deeper, use PageSpeed-Insights for WordPressto immediately assess the effects of changes.
Stores and complex WordPress setups
WooCommerce, Memberships, Multilingual and Page Builder increase the complexity. I ensure performance despite dynamics by combining server- and page-related optimizations.
- Cache bypass accurate: Keep shopping cart, checkout, account pages dynamic, but cache category pages and static blocks as much as possible.
- Fragment caching: Cache reusable areas (header, footer, mini-cart) as fragments on the server side.
- Search & Filter: Keep Ajax endpoints lean, set database indices and minimize response sizes.
- Discipline Builder: Switch off unnecessary widgets and global scripts, only load page by page where they are needed.
- Image variants: Provide product images in meaningful breakpoints and art-direct them so that LCP remains stable.
Hosting speeds things up: choose the right tariff, server and CDN
A good score stands and falls with fast InfrastructureI therefore make sure I have the latest PHP versions, fast NVMe memory and sufficient CPU resources. When the load increases, upgrading the tariff pays off faster than elaborate code tricks, because the server response acts on every request. HTTP/2 or HTTP/3 provides parallel transfers and reduces overhead, which makes many small files cheaper. A CDN shortens paths to visitors, lowers latencies and noticeably reduces the load on the origin server. For demanding projects, I recommend Webhoster.de, because it combines performance reserves, support and useful additional functions, and real Peak values enable.

International audience: Configuring CDN strategies correctly
Latency and consistency count for global traffic. I set up the CDN so that content close and at the same time be personalized correctly.
- Cache Keys: Only vary really relevant parameters (e.g. language, currency). Remove everything else from the key.
- Stale-While-Revalidate: Users immediately receive a cached version, while a fresh load takes place in the background.
- Brotli & compression: Compress HTML, CSS, JS; offer WebP/AVIF for images on the server or edge side.
- TTL strategy: Cache static assets for a long time, HTML moderately. Automate purge when content is updated.
- Geo-Routing: Prioritize PoPs in core markets and make routing problems visible via monitoring.
Read and prioritize Lighthouse scores correctly
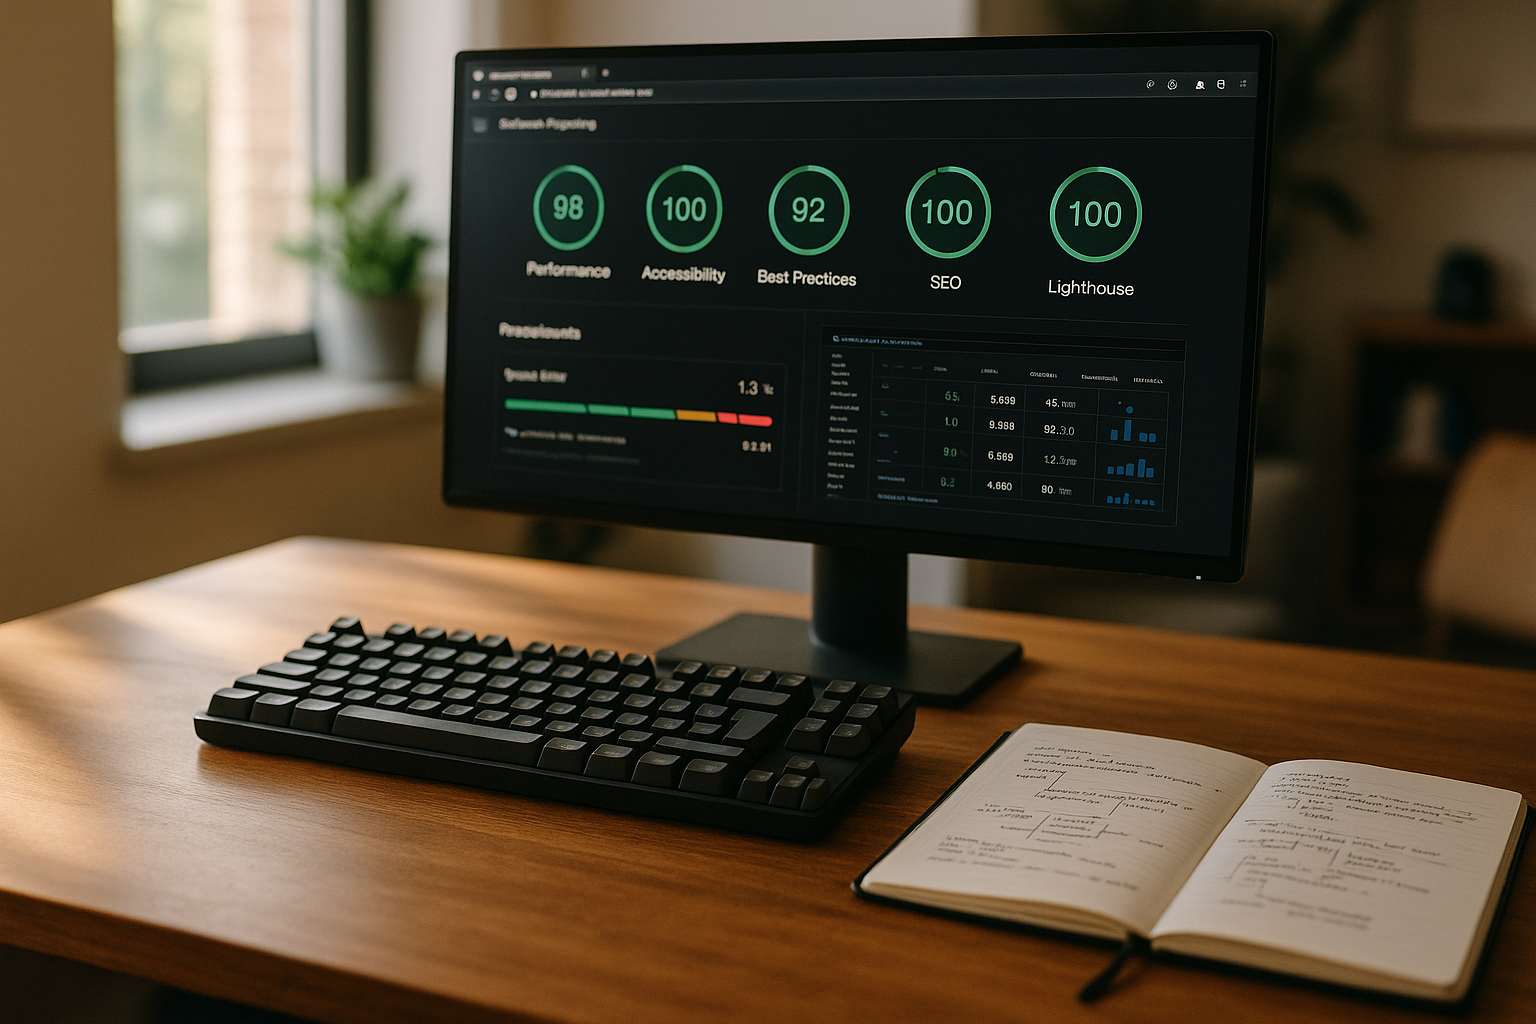
I look at the performance score first because it has a direct influence on bounce rates and Turnover has. I then check SEO signals such as correct metadata, mobile-friendly displays and indexable content to avoid technical friction. Accessibility controls usability for all people and also reduces support costs, which is why I take warnings seriously here. Best practices cover security and modernization aspects, such as HTTPS, secure libraries and correct image sizes. I derive an action plan from all four scores, start with high benefit per effort and document the effect of each change for future reference. Audits.
From score to business success: measuring impact
Performance without effect is an end in itself. I link optimizations with Business KPIsso that effort pays off and priorities remain clear.
- Define baseline: Record LCP/TBT/CLS and metrics such as conversion, bounce and time on page before tuning.
- Hypotheses: "-500 ms LCP increases CR for mobile buyers by 2 %" - formulate concrete expectation and test.
- A/B-informed: I test changes that affect UX step by step so that there is no false progress.
- Attribution: Link changes in changelogs with measurement windows. This allows effects to be clearly assigned.
- In the long term: Factor in seasonal fluctuations and consider results over several cycles.
Comparison: Hosting provider and Lighthouse score at a glance
A fast host makes any tuning easier, which is why I evaluate loading times, server response and achievable scores together with the appropriate Target group. The following table shows a compact example of how I translate performance data into decisions. A test winner provides room for improvement for growing projects and reduces the number of workarounds. For small teams, a less expensive plan can be sufficient as long as the core metrics remain stable. If you want to scale, you benefit from reserves and technology that is reliable even under load. performs.
| Place | Provider | Loading time | Score Lighthouse | Recommended target group |
|---|---|---|---|---|
| 1 | Webhoster.com | Very fast | 98 | All, especially for WordPress |
| 2 | Provider B | Fast | 92 | Small companies |
| 3 | Provider C | Medium | 88 | Private blogs |
DevTools in depth: Timeline and coverage
Lighthouse shows what to do, DevTools tell me where exactly where I need to start. I use the performance timeline to identify expensive tasks, layout thrashing and long repaints. Coverage shows unused CSS/JS as a percentage - ideal for streamlining bundles.
- Tag long tasks: I scrutinize everything over 50 ms, split up functions and move work away from the main thread.
- Layout & Paint: Frequent reflows indicate DOM manipulations at the wrong moment. I bundle updates and use requestAnimationFrame.
- Unused Bytes: Remove unused CSS/JS from templates or load dynamically to reduce TBT and download times.
- Network waterfall: Optimize the sequence and priorities of requests, bring critical resources to the front.
Stay permanently fast: Maintenance, monitoring and hygiene
I repeat audits regularly, ideally every couple of weeks, because updates, new content and campaigns can change the Performance change. I keep versions of PHP, MySQL, plugins and themes up to date in order to benefit from security and speed advantages. I check log files and error consoles on a weekly basis so that hidden problems don't go unnoticed for months. For smaller sites, many steps can also be solved without additional extensions; if you want, you can make your site faster without plugins and saves overhead. Discipline is important: document measures, measure effects and, if necessary, roll them back if an experiment fails. Score deteriorated.
Monitoring and alerting
After optimization, the Monitoring. I set up threshold values for LCP, TBT and CLS and have deviations reported to me. I also monitor error rates and timeouts so that infrastructure problems become apparent at an early stage.
- Observe RUM data: Segment real usage data by device, country and template to quickly identify outliers.
- Uptime & Apdex: Availability and perceived performance (Apdex) help to evaluate user experiences holistically.
- Release guard: Measure closely after deployments and roll back automatically in the event of regressions.
Audit checklist for the next run
- Create a fresh Lighthouse report for mobile and desktop, average 3-5 runs.
- Cross-check field data and prioritize target URLs with high traffic.
- Verify server response times, PHP version, database and OPCache.
- Inventory images, identify LCP asset, optimize sizes/format.
- Eliminate render-blocking CSS/JS, define critical CSS.
- Evaluate, asynchronize or load third-party scripts after interaction.
- Clean up WordPress plugins, configure caching levels properly.
- Check CDN/cache keys, TTLs and compression, test purge processes.
- Process accessibility and best practice warnings.
- Measure result, document, plan next iteration.
Practice workflow: From findings to implementation
I always start with a fresh Lighthouse report, highlight the biggest time wasters and set a clear Sequence. Then I fix hosting issues, because every server improvement reinforces all further steps. This is followed by images and static assets, as this is often where the biggest savings are made and users feel the effect immediately. I then tidy up JavaScript and CSS, reduce blocking times and ensure interaction. Finally, I check the metrics again, document the results and plan a follow-up measurement so that the site remains reliable in the long term. runs.

Briefly summarized
With Lighthouse I get a clear Roadmap for acceleration: LCP down, reduce TBT, avoid layout jumps and secure interaction. Hosting, file sizes and scripts provide the biggest levers if I tackle them in this order. WordPress benefits noticeably from plugin discipline, clean caching and compact images. Repeated audits record improvements and maintain progress over months. If you want speed, stability and predictability, choose a strong host like Webhoster.de and use the Lighthouse site analysis as a Standard tool for each change.