Skip to content
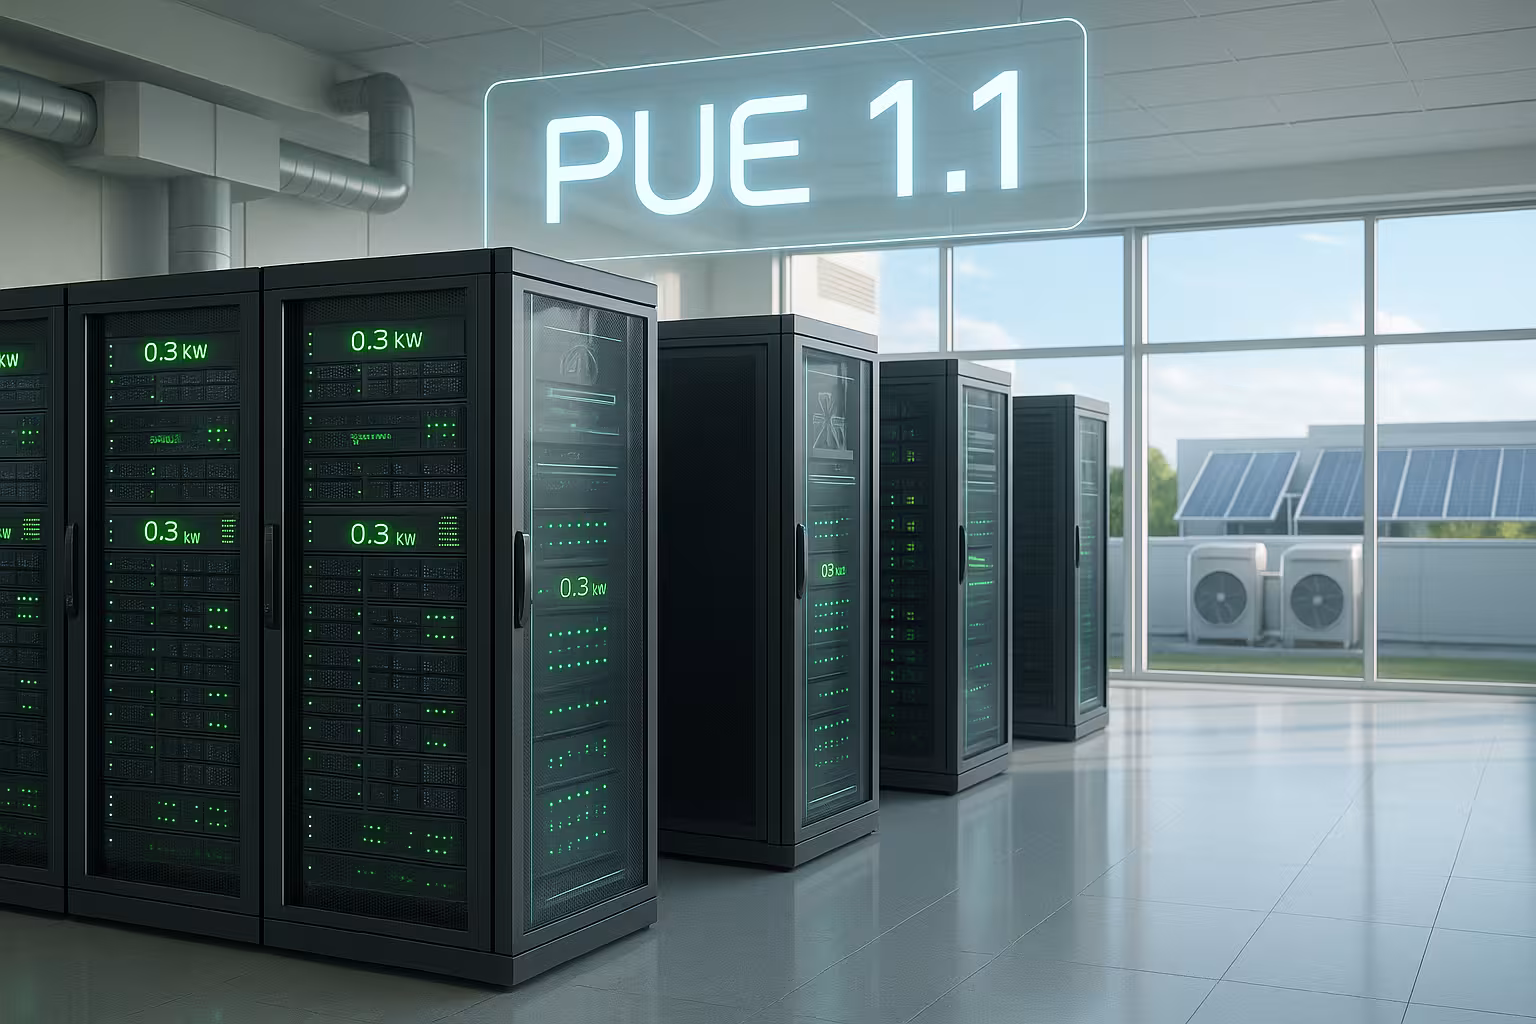
The PUE value measures how much of the energy used by a data center is used directly in IT performance flows and how much is lost to auxiliary consumers such as cooling and current transformers. The closer the value is to 1.0, the more efficiently the Infrastructure - realistic peak values for modern locations today are around 1.2 [2][3].
Key points
To help you quickly grasp the most important statements, I will summarize the key aspects in advance and go into more detail later. A low value indicates high Efficiency, a high value indicates potential savings in cooling, power path and IT load. For reliable decisions, you need a clear measurement strategy with Real-time data. Measures such as free cooling, air routing and liquid cooling reduce the ancillary costs of performance. Investments in monitoring and optimization often pay for themselves through savings. Energy costs. With an ongoing operating strategy, the system remains operational even when demand grows. sustainable.
- DefinitionRatio of total energy to IT energy, target close to 1.0.
- LeverCooling, flow path, air routing, utilization.
- MeasurementGranular counters, uniform method, trend analysis.
- TechnologyFree cooling, hot/cold aisle, liquid cooling.
- StrategyOngoing optimization, maintenance window, invest plan.
What does the PUE value mean in concrete terms?
I use the PUE value to determine the energy efficiency of a building at a glance. Balance of a data center. If the value is 1.0, all the energy flows into the server, storage and network - without additional losses in cooling, UPS or lighting. In reality, this remains a theoretical point, but modern sites reach 1.2 to 1.3 in the medium term [2][3]. Anything above 1.6 makes it clear to me that cooling and the power path are too much Energy consume. For a detailed definition and classification, please refer to the article PUE value in detail.
Calculation and typical values
The formula remains simple: total energy divided by the energy of the IT devices - this is how I recognize the proportion of Incidental costs per kilowatt of server load. It is important that the measuring points are uniform throughout the year so that seasonal effects do not have a negative impact. False conclusions generate. I always compare values on a monthly and annual average, supplemented by load profiles throughout the day. Modern hyperscalers communicate average values of around 1.2 [2][3], while mature environments are often between 1.6 and 2.0. A properly planned setup with reasonable utilization can reach or fall below 1.4 [4].
| Key figure | Formula | Example | Statement |
|---|---|---|---|
| PUE | Total energy / IT energy | 1,20 - 1,40 | Efficiency of the overall facility |
| DCiE | 1 / PUE | 71% - 83% | IT share of total energy |
| IT energy | Server/storage/network performance | z. e.g. 500 kW | Payload for computing work |
| Auxiliary consumption | Total minus IT | z. e.g. 150 kW | Cooling, UPS, fans, lighting |
Factors influencing the PUE
I see the greatest leverage in the cooling system, followed by the electrical system. Supply path and IT utilization. Efficient cold air supply, clear separation of hot and cold aisles and tight air ducting reduce mixed air losses. I keep the temperature within a safe corridor in accordance with ASHRAE recommendations and raise it gradually if the hardware allows it. In the power path, I rely on modern UPS topologies with high partial load efficiencies and short transformation chains. For the IT load, an even utilization increases the Useful energy per kilowatt - idle servers waste PUE potential.

Cooling solutions: from free cooling to liquid cooling
I start with free cooling as soon as the climate allows it, and only use adiabatic support when necessary to keep the Energy requirement to lower. In high-density clusters, I plan to switch to direct-to-chip or immersion solutions because air reaches its physical limits. If you want to run densities beyond 20-30 kW per rack cleanly, you can use Liquid cooling and keeps the air cool for peripherals. This reduces the use of fans and compressors and brings the PUE closer to efficient target corridors. I always look at the overall effect: a technically brilliant cooler is of little use if the air paths and the sealing of the racks lick.
High-density loads: Realistic planning of AI and HPC
AI and HPC stacks are shifting the Thermal30-80 kW per rack are no exception, individual islands are significantly higher. I plan such zones as separate thermal domains with separate cooling circuits, short hydraulic paths and a clear redundancy strategy. For direct-to-chip solutions, I take pump capacity and control valves into account in the Total energy, because their consumption counts as a facility component in the PUE. The aim is a high return temperature range so that free cooling takes over more hours and chillers work less frequently. In mixed environments (air + liquid), I ensure clean decoupling: air remains for peripherals and storage, liquid carries the high-density load.
I evaluate power supply unit and Busbars-capacities, as current peaks from the accelerators affect UPS operation and therefore efficiency. Telemetry on every sealed rack, supply/return temperature and Delta-P on the cooling circuit are mandatory. In this way, I maintain PUE advantages even with dynamic utilization without jeopardizing stability. Where possible, I raise the water temperatures to improve the efficiency of cooling generation - this reduces compressor hours and saves money.
IT load, density and architecture
I consolidate workloads, switch off zombie servers and right-size the footprint so that every kilowatt hour counts. Virtualization, containers and automatic power management increase the average utilization without loss of service. High rack density saves building and airway losses, as long as cooling and power supply follow suit. I control BIOS and firmware settings, activate efficient P-States and use economical power supply units with a high efficiency class. This sum of small steps creates noticeable PUE effects and strengthens the Performance of the system.
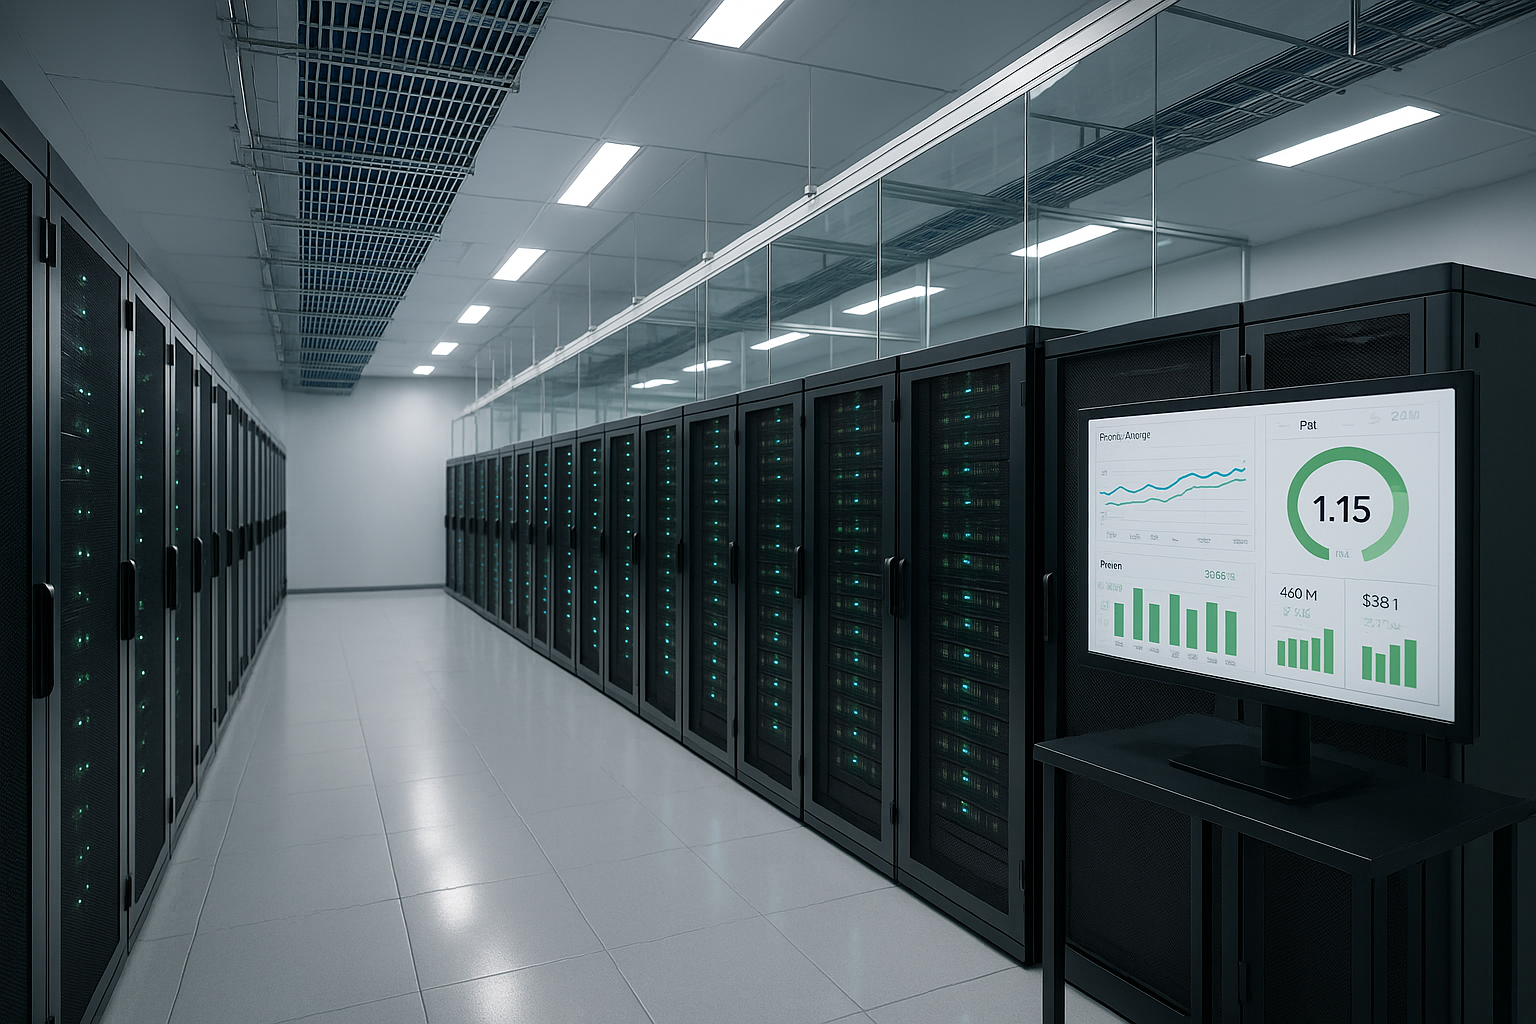
Measure, monitor, act
Blindly optimizing without clean measuring points is of little use - I therefore install meters on UPS, PDUs and on representative IT clusters. A DCIM or energy management system consolidates the data, alerts in the event of deviations and makes successes visible. I define a measurement method and stick to it so that trend comparisons remain reliable. I evaluate seasonal peaks separately from base loads in order to clearly identify the effectiveness of individual measures. On this basis, I plan maintenance windows, adjust setpoints and secure investments with Facts from.
Measurement methodology and comparability
For reliable PUE values, I use the Measuring frame clearly: Which consumers belong to facility energy (cooling, UPS, switchgear, lighting, security technology), which to IT (server, storage, network)? I consistently separate office areas, workshops and test stands or identify them transparently. I measure at the power supply level of the data center and at the IT distribution level (RPP/PDU/Rack-PDU) so that losses along the path can be tracked. Monthly averages, rolling 12-month averages and time-of-day profiles give me different perspectives and prevent Snapshots without significance.
I strictly separate design PUE, commissioning PUE and operating PUE: the design value shows potential, the operating value shows reality. For heterogeneous areas, I use zonal PUEs (e.g. HPC area vs. standard area) and weight them according to Performance. The stability of the method is important: I don't change measurement points „on the fly“, but document adjustments to keep trends comparable. This allows the effects of individual projects to be clearly isolated and credibly reported both internally and externally.
Costs and business case
Energy eats up the budget, so before each measure I calculate the expected effect per euro invested through. Example calculation: If the IT consumes 500 kW and the system 700 kW in total (PUE 1.4), electricity costs around €351,000 per year at €0.20 per kWh. If I reduce the PUE to 1.3, only 650 kW are required - that saves around €87,600 per year. This justifies part of the investment in air ducting, seals, UPS upgrades or liquid cooling. I document every step and link it to measurable Results, so that budgets are easier to pass in the future [1][3].
Redundancy levels and their influence on the PUE
High availability costs EfficiencyN+1 or 2N topologies keep reserve paths active and reduce the utilization of the active devices. UPSs running at 20-30% load are less efficient than at 60-80%. I therefore plan modularly, scale stages to suit the load and use operating modes with high partial load efficiencies - where the risk analysis permits. Chillers with good „turndown“ and frequency-controlled pumps/fans avoid partial load losses. Rotating standby concepts (alternating active strings) distribute the load more evenly and improve the efficiency. Efficiency.
Redundancy remains non-negotiable, but I optimize the power and cooling path as short as possible and avoid unnecessary conversions. Close-coupled cooling (in-row/rear-door) reduces transport losses without sacrificing redundancy. I consciously weigh up: a minimally better PUE has no value if it reduces the Resilience reduces. Transparency is crucial: I document which PUE belongs to which redundancy class so that comparisons remain fair.

Sustainability and energy sources
I combine PUE optimization with clean procurement of electricity because „efficient“ and „low-emission“ are two Couples form. Green electricity contracts, locally generated photovoltaics and waste heat utilization further reduce the carbon footprint. Via heat exchangers or district heating feed-in, the server waste heat becomes a product that generates added value in euros. Availability and security reserves remain non-negotiable - I always keep an eye on redundancy levels and thermal buffers. If you want to delve deeper into sustainable operating models, you can find suggestions at Green Hosting and translates these step by step into realizable Plans um.
Energy reuse and ERE
Using waste heat shifts the world of key figures. In addition to PUE, I use the Energy Reuse Effectiveness (ERE): (total energy - reused energy) / IT energy. This is how I map that the system not only cools efficiently, but also Useful heat generated. A project with a slightly poorer PUE but high waste heat extraction can be superior overall. I make sure that the heat is available at a usable temperature level - the higher the return, the simpler and more economical the feed-in. Clear communication is important: PUE and ERE should be considered together to avoid creating false incentives.
Location, climate and planning
A cool climate provides free hours for free cooling and reduces the PUE over the year measurable. I assess humidity, air quality, water availability and network infrastructure at an early stage because location decisions have a long-term effect. Building geometry, room height and air paths determine how efficiently air or liquid dissipates heat. Logistical aspects also count: short energy paths, short refrigerant routes and clear maintenance zones. Smart planning at the start saves a lot later on. Adjustments and reduces operating risks.
Partial load, regulation and control strategies
The best construction plan only works with clever Regulation. I define deadbands, staggering and priorities: Free cooling first, adiabatic stages next, compressors last. Fans, pumps and air curtains run speed-controlled as required - this reduces partial load losses. Weather and load forecasts help me to proactively set flow temperatures instead of reactively chasing them. I create cooling zones along real load clusters and avoid overcooling one because another has a peak load. This keeps the PUE constant even with changing profiles stable.
I pay attention to „hunting“ in control loops: unstable sensors or poorly positioned sensors lead to constant corrections and cost energy. I regularly calibrate sensors and verify characteristic curves - especially after conversions. If electricity prices are billed variably according to time, I use flexible setpoints and load shifting, without having to change the Service quality to jeopardize. These operational subtleties add up to noticeable efficiency gains.
Practical to-dos for the next quarterly plan
I start with a thermal audit, close cold aisle gaps and optimize rack panels so that no Bypasses arise. I then calibrate the sensors, set clear alarm thresholds and carefully increase the flow temperature. I replace inefficient fans and activate EC technology to reduce partial load losses. At the same time, I rely on server firmware updates, activate energy-saving profiles and remove unnecessary cards. Finally, I piloted a liquid cooling island for tight racks and gained experience before finalizing the solution. scale.
Commissioning and re-commissioning
I don't consider commissioning to be a point, but a Process. After formal acceptance, I test seasonal cases (summer/winter), full load and partial load scenarios as well as switchovers under real conditions. Recurring re-commissioning - approximately annually or after major changes - ensures that the controls, sensors and redundancy paths work as planned. I link these tests with measurement and verification plans, document deviations and rectify them in a structured manner. This ensures that the data center remains efficient and reliable throughout its life cycle. robust.
Transparency, „PUE gaming“ and governance
I disclose how PUE is measured and avoid Beautiful arithmetic. This includes not „outsourcing“ any consumers just to reduce the value and not selecting any measurement points that hide losses. Internal guidelines define responsibilities, target corridors and escalation paths so that PUE, WUE and CUE are considered together. I anchor efficiency targets in maintenance and change processes: Before every change, I check the energy impact; after every measure, I measure the effect. This governance model creates comparability across teams and years - and prevents short-term optimizations from being Long-term goals undermined.
PUE is important, but not everything
I evaluate PUE together with WUE (water) and CUE (CO₂) so that there is no bias. Incentives arise. A measure that greatly increases water requirements may be unsuitable in regions with scarce resources. I also keep an eye on service levels and redundancy: Availability comes before cosmetic savings. Transparent communication creates trust - figures without context lead to false conclusions. PUE remains the key indicator for energy efficiency, but it is only in combination with other indicators that a round Figure [1][3].

Briefly summarized
The PUE value clearly shows me how much of the energy used is actually invested in Computing power ends up and where losses occur. With clean measurement, clever cooling, an efficient power path and well-utilized IT, I can noticeably reduce the ancillary costs of power. Realistic target corridors reach up to 1.2 for modern systems [2][3], sensibly planned environments achieve 1.3 to 1.4 [4]. I check every investment against savings in euros and document the effect over time. In this way, the data center remains economical, climate-friendly and technically powerful - today and tomorrow.