Skip to content

Redis Insight 2.x helps you investigate Redis keys, memory anomalies, and slow commands in existing installations. However, this version is no longer current: The last documented maintenance release, 2.70.1 from July 2025, was followed by Redis Insight 3.0.0, which was designated as the November 2025 release and published on GitHub on December 4, 2025. For Accurate Diagnoses You must therefore clearly separate the installed version, the database, and the permissions: The GUI complements redis-cli, but it does not replace either monitoring or controlled change processes.
Putting Redis Insight 2.x in Perspective
Redis Insight 2.x will be an older product line by 2026, not the current interface. The last documented maintenance release is 2.70.1 from July 10, 2025; it followed 2.70. Redis Insight 3.0.0 is listed in the official release notes as the November 2025 release and was published on GitHub on December 4, 2025. Anyone running an existing 2.x installation should therefore evaluate its features based on the respective version.
This time limit is important from a practical standpoint: A navigation feature that was revised later, or a custom workspace introduced only in version 3.x, must not be retroactively considered a feature of version 2.x. For operational documentation and training, the installed version of Redis Insight should therefore always be specified. This is the only way to ensure that it remains clear which interface, search function, or editing capabilities were actually available.
Redis Insight refers to a management and diagnostic application, not the Redis server software. The server version, the Redis deployment, and the GUI each have their own release cycles and compatibility considerations. For decisions regarding server versions, support periods, and operating models, see the article Redis 8: New Features and Upgrade Decisions for Hosting Providers the more appropriate classification. The GUI does not replace this check.
In existing installations, 2.x remains a viable working environment, however, as long as teams consciously work within its feature set. The focus is then on guided exploration of individual instances, keys, and commands, rather than assuming that every newer Redis Insight feature is available. A clean Version History Prevents incorrect decisions when following instructions and performing troubleshooting.
In particular, version 2.70 introduced connection tags as well as full editing and searching within JSON values. These are specific enhancements to this 2.x branch, but they are not guaranteed for every older 2.x installation. Before creating a work order, the team should therefore verify the patch status, activated data modules, and the role of the target instance.
Using the Redis GUI as a Diagnostic Tool
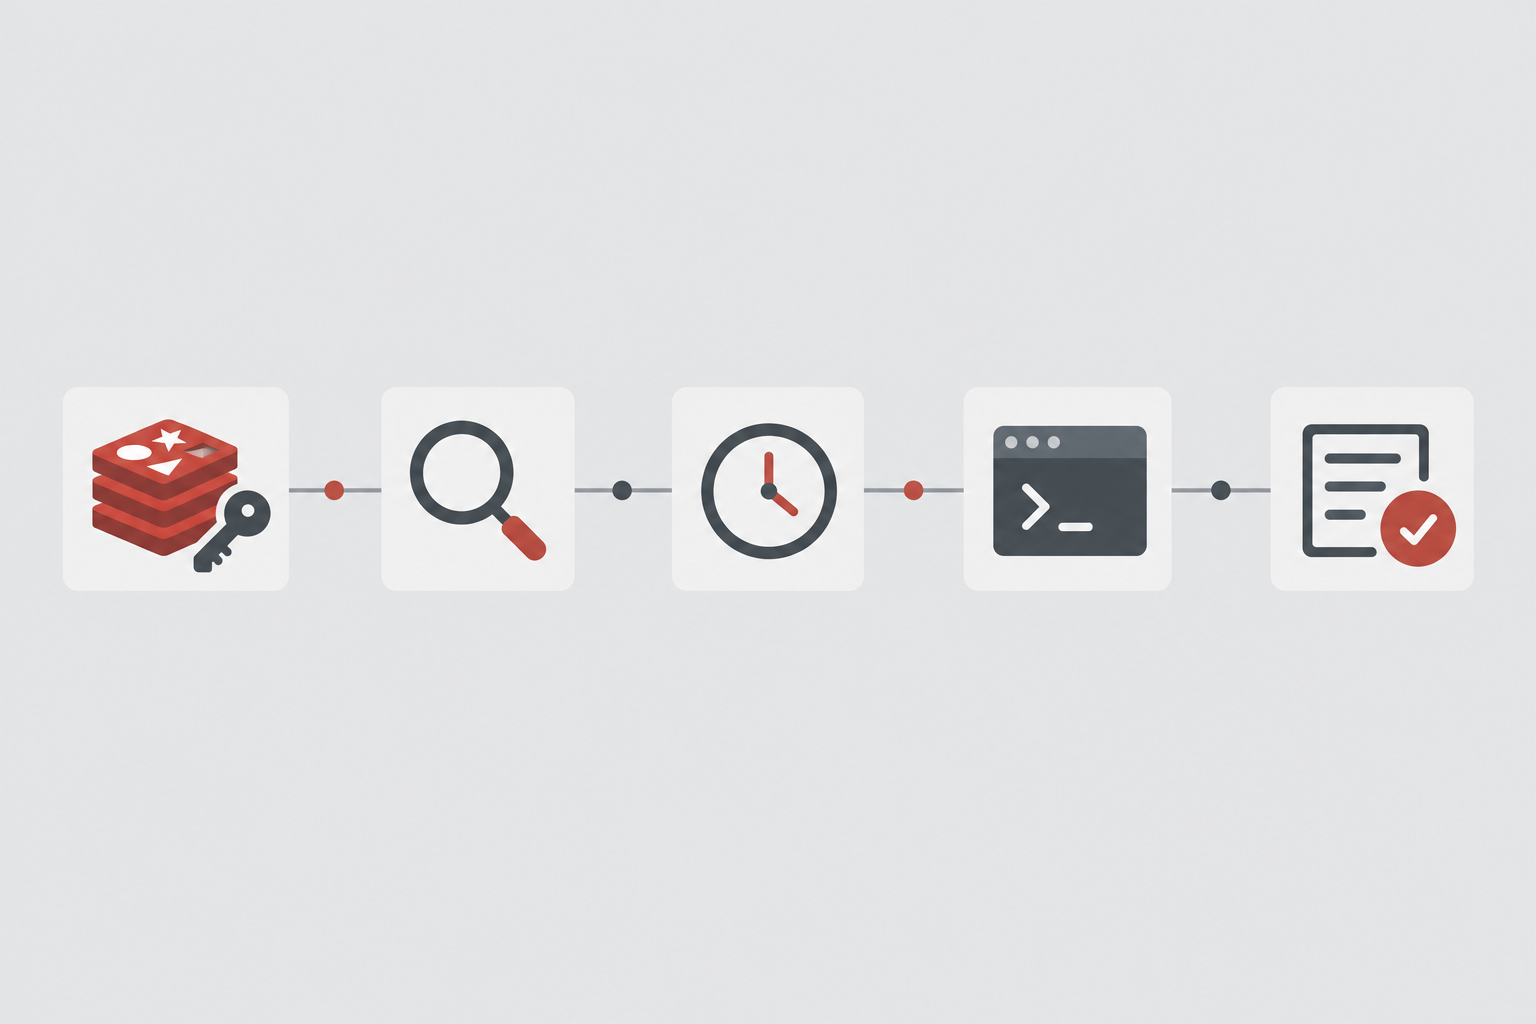
Redis Insight has been added redis-cli to provide a graphical view of Redis databases. The browser helps locate and display keys, while the integrated command interface and workbench enable direct queries. This allows administrators to combine visual insights with traceable Redis commands without having to give up the command line as a tool for scriptable or targeted checks.
The other sections address different issues. "Database Analysis" examines the key set, while the "Slow Log" section displays slow commands logged on the server side. The profiler available in the 2.x series, on the other hand, is intended for limited live monitoring; its results should not be equated with a complete history analysis. Bulk Actions are used to process multiple keys. These functions are part of a Diagnostic chain – They do not provide comparable measurements and should not be interpreted as interchangeable.
A sensible workflow begins with a specific question: Is a namespace unusually large, does a key contain unexpected data, or did a slow command occur at the time of the issue? Next, select the appropriate area and document your findings. Workbench, with its autocomplete and visualizations, can make reading control queries easier, but it does not replace a technical review of the results.
As Redis GUI Above all, Redis Insight provides an overview and a common starting point for operations and development. However, it is not a complete monitoring system. Long-term trends, alerting, capacity planning, and correlation with infrastructure metrics still require dedicated metrics, logging, and alerting systems. A snapshot view in the interface does not constitute a reliable forecast.
Live tools also require limited use: You start the profiler to test a hypothesis and stop it after the observation window. Even the release notes for Redis Insight 2.0 warn against using the underlying MONITOR-Allowing a command to run for an unnecessarily long time on a production server. This manual approach would be unsuitable for recurring warnings. The interface thus helps narrow down an incident; continuous monitoring of service quality remains a separate operational task.
Effectively Protect Access and Production Data
Before connecting, it should be clear what role the instance serves: cache, session store, queue, or primary database—each requires a different level of caution. Also check for known key prefixes, the data structures used, and the responsible service. This classification prevents a technically unusual key from being modified or removed without understanding its business significance.
For production systems, it is advisable to set up a separate ACL user whose permissions are tailored to the specific diagnostic commands and key ranges required, and who is not granted any unnecessary write permissions. Redis ACLs can restrict commands and key access, thereby reducing damage caused by manual operating errors. The specific permissions required by Browser, Database Analysis, Slow Log, or Profiler must be verified individually for the version of Redis Insight being used and the intended workflow.
The separation between reading and writing must fit the workflow. A finding may first be documented, verified using a representative key, and assigned to the responsible team. Write permissions are only required when an approved change is pending. A user-friendly display in the GUI does not constitute authorization or a technical justification for intervention.
JSON values illustrate this limitation particularly clearly. Redis Insight 2.70 supports full editing of JSON values and searching within an open JSON key. These features make it easier to trace a data error, but they do not protect against incorrect content, an incomplete change, or an unintended impact on the service that generated the data.
Warning: In production, do not process JSON values or multiple keys based solely on visual observations. In particular, functions that perform actions on multiple keys require unambiguous selection, business approval, and a secure change management process. A process limited to diagnostic tasks Production Input reduces the risk, but does not replace these checks.
Systematically check connections and keys
The first step is to uniquely identify each stored connection. In Redis Insight 2.70, connections can be organized using tags, such as by environment, application, and responsible team. A scheme such as „production,“ „shop,“ and „platform“ helps prevent confusion between similarly named instances and ensures the correct database is selected for analysis.
These tags are local metadata from Redis Insight or are imported from Redis Cloud or Redis Software. They do not change the server configuration, ACLs, keyspace, or replication. For this very reason, they do not replace a thorough verification of the host, database number, instance role, and permissions before an administrator establishes a connection.

In the browser, a targeted review takes place instead of randomly clicking through. First, search for the known key prefix, and then check the name, data type, namespace, TTL, and a few representative values. This allows you to determine, for example, whether a prefix actually groups cache entries, contains sessions, or belongs to a queue. The TTL This is a reference to the operation strategy, not merely a judgment on the quality of the key.
For JSON-enabled databases, Redis Insight 2.70 added full editing of JSON values as well as the ability to search within an open JSON key. This makes it easier to find a specific discrepancy in nested data. For diagnostic purposes, however, simply reading and documenting the findings is usually sufficient; a better representation of a value does not constitute technical approval for a change.
For suspicious keys, record at least the prefix, type, observed TTL, and the expected creator. This turns a single GUI finding into a verifiable question regarding the service, data model, or deployment. Writing operations remain separate from this: They require an appropriate change process and must not be derived solely from the readability of a value.
Caution is advised, especially when working with JSON data. Editing the full data set can unintentionally overwrite fields that are conceptually related, even if the interface clearly displays the structure. First, understand the specific difference; then test it outside of production; and make a change only with the appropriate authorization and approval.
Compare tools, databases, and limitations of the findings
Redis Insight’s tools answer different questions and should therefore not be lumped together into a blanket „monitoring“ assessment. The browser and database analysis examine the key set, while the slow log shows slow commands logged on the server side. For version 2.x, the Profiler should be considered a temporary tool for live monitoring; Workbench and the CLI are used to execute specific queries in a traceable manner.
| Tool | Administrative Question | Data basis | Detection Limit | Production Risk | Next step in the review process |
|---|---|---|---|---|---|
| Browser | Which key belongs to which namespace and type? | Keys and representable values in the linked database | A single view explains neither the cause nor the course of events | Writing Can Change Values | Check TTL, prefix, and generating service |
| Database Analysis | Which types, namespaces, or large keys should be given priority? | Key indicators analyzed; limited analysis and extrapolation for large datasets | No precise inventory of very large databases | Analysis results can lead to hasty adjustments | Check Representative Keys in the Browser |
| Slow Log | Which commands exceeded the server threshold? | Server-side SLOWLOG entries | No network or client I/O time | Entries contain potentially sensitive command data | Correlate client, network, and host metrics |
| profiler | What commands appear during a brief diagnostic window? | Time-Limited Live Monitoring in Redis Insight 2.x | No long-term trend and no complete history | Use observation only briefly and in a targeted manner | Document the hypothesis and test it systematically |
| Workbench/CLI | How can a diagnostic finding be reproduced by reading it? | Redis Commands Executed and Their Responses | Auto-complete does not replace authorization checks | Write commands take effect immediately | Synchronize the read query with the data model and service |
| Bulk Actions | Which keys match the type or pattern? | Selected keys and expected count | Selection does not replace professional approval for deletion | Multiple keys may be adversely affected | Review the scope and obtain formal approval |
The Data basis determines how a result should be interpreted. Database Analysis has been documented as a feature since version 2.12 and examines up to 10,000 keys; for larger datasets, results are extrapolated. It thus prioritizes questions regarding storage, data types, TTL, and namespaces, but does not provide a reliable, comprehensive inventory for a large production database.
The slow log has a different limit: It contains only commands that exceed the threshold configured on the server. The execution time refers to the Redis server and does not include network or client I/O. A timeout in the application code can therefore occur without a corresponding Slow Log entry, and vice versa.
The Profiler supplements this retrospective view with a deliberately brief live window. In the 2.x series, it is intended for use as an ad hoc diagnostic tool, not as a substitute for metric storage, alerting, or capacity planning. Bulk actions belong in the same overview because, while their expected number of hits provides guidance, the function can delete multiple keys.
Targeted Limitation of Growing Cache Volume
If a cache grows faster than expected, do not start the investigation by deleting keys. Begin with database analysis and look for unusual namespaces, data types, large keys, and memory that could potentially be freed up due to expiration. The results help set priorities: They indicate which areas should be examined more closely, but do not yet explain which service is generating the data.
Next, the browser compares several keys from the suspicious namespace. Check the naming scheme, type, TTL, approximate value size, and expected lifecycle. A missing expiration time may indicate an error in the case of a short-lived cache; however, in the case of intentionally persistent data, this finding alone would not be sufficient. The decisive factor is the role that the generating service intended for this key.
The Sample size limit must remain visible throughout the process. Redis Insight 2.12 analyzes up to 10,000 keys directly; for larger databases, it extrapolates the results. Percentage values or memory distributions then serve as good guidelines for the order of further checks, but they do not provide an exact picture of every prefix, every type, or the actual total memory usage.
The examples examined lead to a specific hypothesis, such as: A particular worker is generating responses without the expected execution time, or a new key prefix is producing unusually large lists. This hypothesis is tested against the service generating the data, its configuration, and the data model. This approach investigates the root cause rather than simply reducing the visible volume of data.
Bulk actions do not automatically clean up data in this case. Redis Insight can process large numbers of keys based on type or pattern and displays an estimated count. It is precisely this scope that makes the feature potentially destructive: patterns, the target environment, and the scope must be verified independently; any deletion requires technical approval and a coordinated recovery plan.
If the analysis confirms a memory anomaly, long-term metrics and capacity planning remain important outside the scope of the GUI task. The database analysis provides a snapshot—or a limited evaluation—of the key stock. Whether the growth is sustained, seasonal, or tied to a specific deployment can only be assessed by examining separate time series and the context of the system generating the data.
How to Read Slow Logs and Profilers Correctly
If timeouts occur only at certain times, start by narrowing down the cause based on the time. The Slow Log in Redis Insight shows the entries that Redis generated using the command SLOWLOG recorded on the server side. Check the command name, execution time, affected key, and data structure in the context of the outage time; this will yield a testable hypothesis rather than a hasty conclusion about the cause.
However, this view does not measure an application's total response time. The Redis Slow Log logs only the Command execution time on the server; network traffic and client I/O are not included. An unremarkable slow-log entry therefore does not rule out an overloaded application, network issues, or host bottlenecks. These indicators must be examined separately using client, network, and system metrics.
The Profiler supplements this retrospective analysis with a brief live observation. For Redis Insight 2.x, it should be treated as an ad-hoc diagnostic tool: Start it only when testing a specific hypothesis, and stop it again afterward. The release notes for Redis Insight 2.0 explicitly warn against the underlying MONITOR-Running the command on production servers for an unnecessarily long time. The profiler is not a substitute for continuous monitoring or alerting.

Large keys and commands with high algorithmic complexity are useful clues when investigating the cause of an issue. However, whether they actually contribute to the problem depends on the specific command, the affected data structure, and the timing of the incident. Therefore, always examine slow-log entries in conjunction with client, network, and host data, rather than inferring a cause based solely on key size. The following also helps with the further classification of thresholds and diagnostic patterns: Guide to Slow-Log Analysis.
For a read-only cross-check outside the interface, you can use the following commands. They display the current length of the server-side log and the ten most recent entries; they do not modify any keys or configuration.
Verify and modify findings in a controlled manner
A finding from a Redis GUI This is initially a hypothesis, not a change request. Document the key or namespace, the time, the observed type, the TTL, and the expected deviation. Then verify the same information by viewing it in Workbench or the CLI. This allows you to determine whether a suspicious value is an isolated incident, an expected cache effect, or an error in the data model.
Next, the review focuses on the service that generates the data: Which code or background routine writes the key, what processing strategy is intended, and which consumers expect its structure? For JSON data, Redis Insight 2.70 can process complete values and search within an open JSON value. These features facilitate analysis but do not confirm the technical correctness of a planned change.
Changes should first be tested outside of production using an appropriate copy or a suitable test scenario. Document any expected side effects, such as cache misses, invalid sessions, or changes to data formats. Only after technical approval has been granted, a reliable recovery path has been established, and the affected application has been tested is it acceptable to make changes to the production instance.
Auto-complete and visualizations in Workbench reduce typos and make responses easier to read. However, they do not replace Change Processes nor backups or authorization checks. ACLs can restrict commands and accessible keys, thereby limiting manual errors. For purely diagnostic tasks, the access used should therefore not have any unnecessary write permissions.
Warning: The ability to fully edit a JSON value does not mean it is safe to make direct corrections. In particular, changes to multiple keys can result in states that the service generating the data does not expect. Therefore, keep the identification, testing, approval, and implementation phases separate, even if the interface makes editing technically easy.
Deciding to Use Redis Insight 2.x in Production
In existing installations, Redis Insight 2.x is well-suited for guided case-by-case analyses: organizing connections, examining keys, tracing server commands, and prioritizing suspicious data sets. The graphical user interface complements scriptable queries with reasonably plausible diagnoses and is especially useful when browsing, analysis, and command-line tasks come together in a single workflow.
The tool alone is not sufficient as a basis for operation. In version 2.12, Database Analysis directly analyzes up to 10,000 keys and scales up for larger datasets. In version 2.x, the Profiler is intended for a limited live diagnostic window, while the Slow Log depends on a server-side threshold and log length. None of these tools alone provides reliable long-term trends or capacity forecasts.
To handle alerts, historical comparisons, and the planning of storage or load reserves, the operation also needs a metrics, logging, and alerting system. Redis Insight can provide concrete insights: For example, an alert about increasing storage usage leads to an analysis of namespaces and TTLs; a timeout notification leads to a comparison of the slow log, client telemetry, and host data. Manual GUI interventions remain controlled exceptions in this process.
The decision to continue using 2.x therefore depends on the specific use case and security level. For a secure production environment with clearly defined access rights, the line can still be helpful for individual investigations. If, on the other hand, a team requires features from later 3.x interfaces, these must be evaluated separately in terms of migration effort, compatibility, and approval processes; they must not be retroactively considered features of 2.x.
Redis Insight 2.70.1 is the last documented maintenance release in the 2.x line, dated July 2025. Redis Insight 3.0.0 is listed as the November 2025 release and was published on GitHub on December 4, 2025. An upgrade is therefore not an automatic response to every diagnostic need. Instead, check whether the existing installation reliably supports the required analyses and whether the requirements go beyond a simple case-by-case analysis.
Sources and Current State of Knowledge
Status of the research:
Version information researched on November 3, 2026. Redis Insight 2.x is treated as an older product line: 2.70.1 is the last documented maintenance release, dated July 10, 2025. Redis Insight 3.0.0 is listed in the official release notes as the November 2025 release and is listed on GitHub with a release date of December 4, 2025.
https://github.com/redis/RedisInsight/releases
https://redis.io/docs/latest/develop/tools/insight/
https://redis.io/docs/latest/operate/oss_and_stack/management/security/acl/
https://redis.io/docs/latest/develop/tools/insight/release-notes/v2.12.0/
https://redis.io/docs/latest/commands/slowlog/
https://redis.io/faq/doc/2no7qfbtpf/