Skip to content
I'll show you how I Redis Offset read and analyze data in a targeted manner and ensure high dataConsistency I use it to identify replication gaps early on, assess failover risks, and keep production clusters reliably in sync.
Key points
The following key points provide a focused introduction to the topic, terminology, and practical implementation.
- Offset Measures the progress of the replication stream byte by byte.
- Lag is the difference between `master_repl_offset` and `slave_repl_offset`.
- ID+Offset Indicates a specific data version for partial synchronizations.
- backlog Prevents full syncs during brief connection interruptions.
- Monitoring uses INFO/cluster metrics to control alerting and failover.

What does the Redis replication offset mean?
The replication offset is a continuous 64-bit counter that increments with each transmitted Byte Stream between the primary and the replica. From this, I can tell how far the replication has progressed and whether a replica still has work to do. The master_repl_offset On the primary, the offset increases with every newly generated byte, while the replica increments its own counter as soon as it has applied commands. Differences result in a lag in bytes and indicate whether the replica is falling behind. This simple yet effective mechanism makes the offset the key metric for synchronization, failure analysis, and clean failover decisions.
Reading Offsets: Using INFO replication correctly
I almost always begin the diagnosis with INFO replication, because the command returns the relevant fields in a concise format. On the primary, I check `master_repl_offset` as well as the status of connected replicas, including their offsets. On a replica, I also check `master_link_status` and synchronization statuses to identify ongoing full syncs or partial syncs. For a more in-depth analysis, I use structured output and correlate offsets with CPU, I/O, and network metrics. This guide provides me with a thorough introduction to the command: Redis INFO for Monitoring.
Replication ID + Offset: unique data version
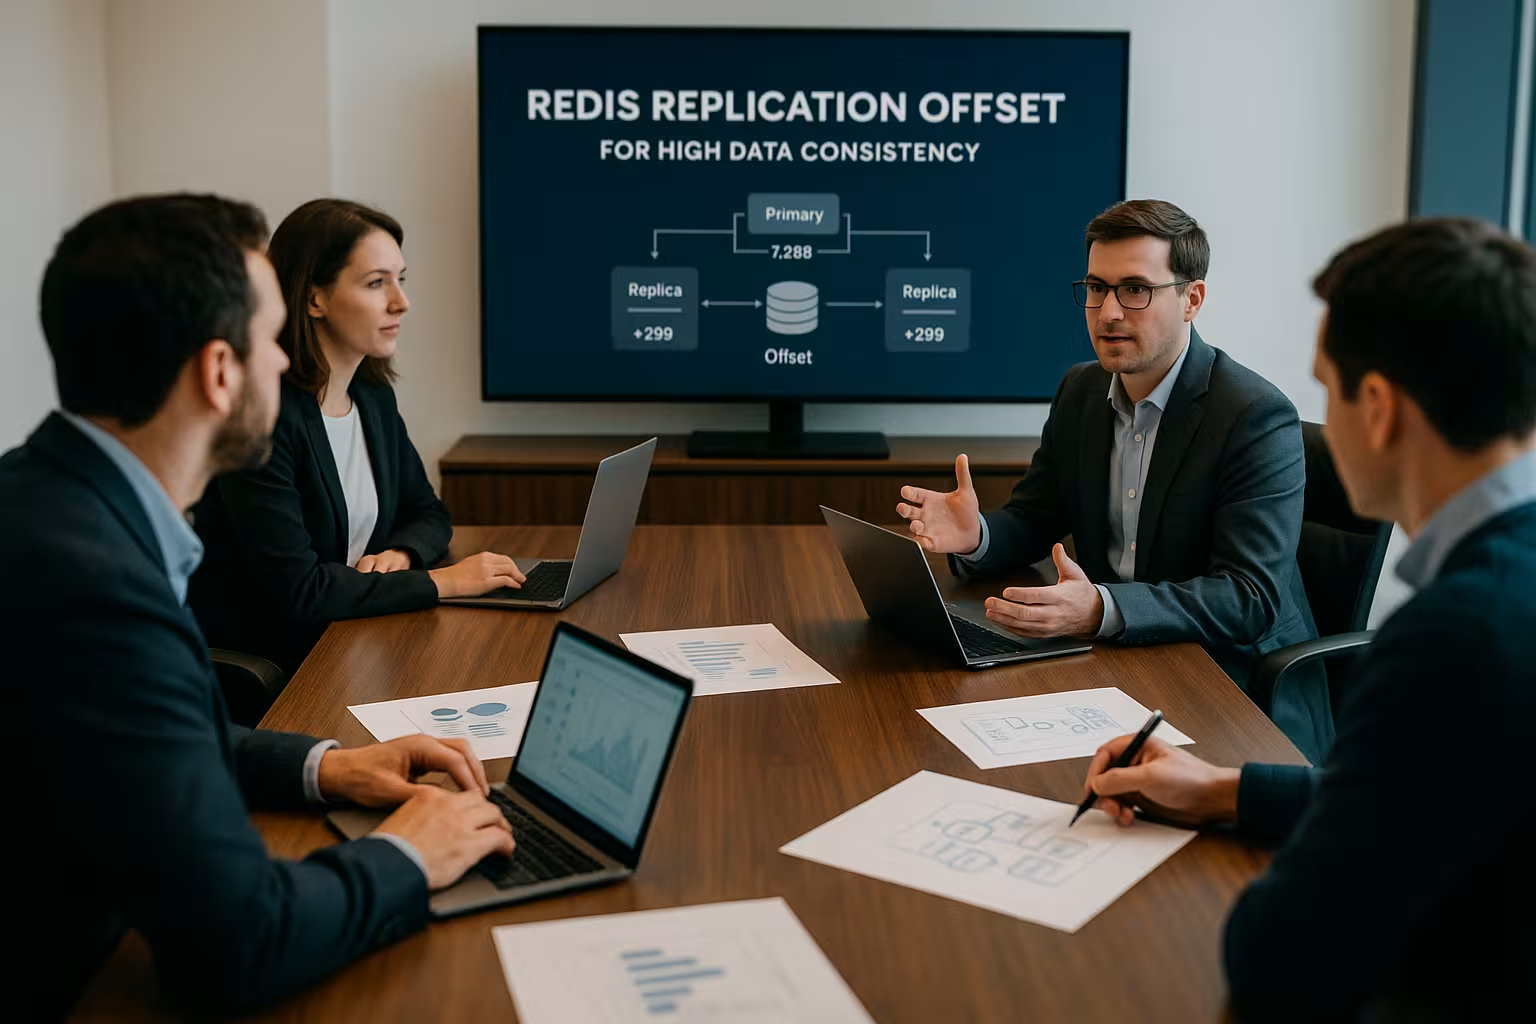
To ensure a unique version, I use the combination of Replication ID and offset. The ID identifies a history, and the offset identifies a position within that history. If the ID and offset match for two instances, I assume that both have the same data state. This combination makes partial resync possible because a replica can tell the primary exactly where it last left off. This also allows me to determine whether a failover can succeed without data discrepancies or whether a full synchronization is necessary.
Determining the Size of the Replication Backlog and Gap
The Primary holds a backlog as a ring buffer that stores recent write operations and enables partial resyncs. If the buffer is too small, bytes will run out faster during peak loads, and a replica that is briefly disconnected will miss the partial resync. I size the buffer based on the write profile and RPO targets to ensure that brief interruptions do not trigger costly full syncs. As a rough guideline, I choose a size that buffers at least the expected amount of data over several seconds to minutes of ingestion time. This reduces the gap between the primary and the replica and keeps the reconnection process streamlined.
Accurately Determine Backlog Size
In practice, I don't just estimate the backlog size based on a hunch, but rather based on the actual observed byte stream:
- I determine the Throughput in bytes/s, by measuring the increase in `master_repl_offset` at defined intervals (e.g., 10–60 s) and recording the peak values.
- I define a Permissible interruption duration (e.g., maintenance windows, network flaps) in seconds.
- I multiply the peak bytes per second by the interrupt duration and add a Safety factor (1.5–3×) to this.
Example: 80 MB/s peak, 20 s expected disconnection, factor 2 → 80×20×2 = 3,200 MB backlog. This ensures that a partial sync succeeds even under unfavorable timing conditions. I then check in the monitoring system to see if the backlog rarely approaches its capacity limit; if it does, I increase it incrementally.
Tuning Hz, Batch Sizes, and the Network
In addition to the backlog, I also look at the hz-This setting, because it affects internal maintenance cycles and thus the average lag. I also check write batch sizes, pipeline utilization, and TCP parameters to make the replication flow smoother. Low latency between the primary and the replica directly contributes to smaller offset differences. Bottlenecks on the replica side—such as slow storage devices or limited CPU resources—also increase the offset. I therefore change only one factor at a time, measure the effect on the offset gap, and clearly document the result.
Diskless Sync and Snapshot Effects on the Offset
For full syncs, I prefer to use Diskless Sync, because the primary then delivers the RDB stream directly over the network and does not generate any additional write load on local storage devices. This reduces I/O spikes and stabilizes offsets during connection and disconnection phases. A moderate delay (repl-diskless-sync-delay) gives other replicas time to catch up, so that an RDB stream is used multiple times. I monitor CPU and network utilization for this, because even a disk-less transfer can cause brief lags when dealing with very large amounts of data.
Snapshots (RDB) trigger copy-on-write during a fork. On systems with heavy write activity, this temporarily increases memory usage and can Application rate slow down the replica. So I schedule snapshots for quieter times of the day, check memory reserves, and make sure that replication and AOF paths don't compete with each other.
Partial Resynchronization in Practice
If a replica goes down briefly, I always try a Partial Match to achieve this. When reconnecting, the replica reports its replication ID and last offset, after which the primary delivers the missing bytes from the backlog. If the backlog is insufficient or the ID has changed, a full sync begins with an RDB transfer and a catch-up phase. At this point, I monitor the offsets to see how quickly the replica catches up and when the two counters are once again close together. If the partial sync succeeds, latencies and I/O spikes remain significantly lower.
Replication IDs, PSYNC2, and Reset Behavior
For clean implementations, I rely on the PSYNC2 semantics. The Primary maintains an up-to-date Replication ID and, in addition, a history ID with the corresponding offset. In the case of Restarts or Leadership Changes The primary ID changes; the old ID is retained as part of the history with an end offset. This allows a replica to continue catching up via partial synchronization despite the ID change, as long as the required range is in the backlog. I evaluate in INFO replication That's why I check both IDs along with their offsets to determine whether an ID change has just occurred or is about to happen.
It's important to note that the offset is monotonous per history, but an ID change defines a new timeline. I document this change during operation so that trend analyses can correctly classify the jump. A 64-bit offset practically never overflows; much more relevant are restarts, failovers, or backlog reconfigurations, which affect the history.
Client Receipts and Shelf Life in the Offset Context
Show offsets Progress, but no guarantees regarding durability. When I need confirmation regarding replicas, I also use:
- WAIT: The primary confirms after N replicas have received a write command and stored it in their input buffers. This is faster than full-sync safety, but does not guarantee persistence on storage devices.
- minimum number of replicas to write and min-replicas-max-lag: The primary only accepts writes if there are enough nearby replicas connected and their lag remains below a certain threshold. This reduces the risk of a split-brain scenario.
I use these mechanisms in conjunction with the offset: The offset checks the actual Catch-up speed and long-term trends for WAIT/min replicas per command Provide protection. For strict RPOs, I combine them and log both views in the monitoring system.
Alerting and Metrics in the Monitoring Stack
For monitoring, I define clear Threshold values based on the offset difference in bytes. I link this metric to time series from Prometheus/Grafana and trigger alerts if the gap exceeds a defined duration. In addition, I log trends to identify load spikes and plan countermeasures. Dashboards visualize `master_repl_offset`, replica offsets, and the calculated lag, which significantly speeds up operational analysis. I find practical tips for setups with time series here: Redis Monitoring with Prometheus and Grafana.

Runbooks and Escalation Paths
I have established standardized steps so that teams can take targeted action when lag increases:
- warning: Lag > X MB for > Y s → Check the throughput and latency of the replication connection; identify competing jobs (snapshots, large Lua scripts).
- Major: Load is increasing steadily → Backlog utilization, replica CPU/I/O, and network errors (retransmissions, drops) are correlated; throttle the write load if necessary.
- Critical: Backlog is at risk of overflowing → Offload the replica (e.g., temporarily redirect read traffic), schedule a full sync window, or bring in additional replicas.
I document decision trees so it's clear when a failover is still low-risk and when I should wait until the offset gap has leveled off.
Redis Cluster: Evaluating Offsets per Shard
I check offsets in a cluster per shard, because each shard maintains its own replication stream. The CLUSTER SHARDS command provides me with slot ranges, node roles, and the relevant offsets for the primary and replica. Significant discrepancies within a shard indicate risks associated with an orderly failover of that shard. I therefore systematically compare the offsets of all shards and prioritize nodes with minimal lag as candidates for leadership. This way, I keep the overall picture consistent and prevent surprises during failover.
Everyday Cluster Operations: Monitoring Resharding and Slot Migration
At Slot Shifts Write pressure often increases unevenly. I measure offsets per shard during MIGRATE phases to see if individual replicas are falling behind. Longer migration windows combined with small backlogs are particularly tricky: In these cases, I either plan for larger backlogs or stagger migrations to ensure that partial synchronizations are not lost. Before every shard failover, I assess whether the target node has recently taken over slot load and whether its replica offset remains stable.
Use Cases: Interpreting Offset in a Targeted Manner
To assess the replication lag, I systematically compare the masterI compare _repl_offset with each replica offset and use that to determine the age of potentially stale data. Before a scheduled switchover, I assess the failover risk by identifying the closest replica and verifying its consistency over several minutes. If the lag increases repeatedly, I correlate it with network metrics, CPU load, and I/O to identify bottlenecks and resolve them in a targeted manner. For strict durability goals, I also check whether operations are committed to the AOF and how offsets relate to them. These patterns help me base decisions on objective metrics and keep downtime to a minimum.

Cascading Replication and Geo-Layouts
In distributed setups, I often choose Replica Necklaces (Replica-of-Replica) to reduce long-distance traffic. In doing so, I keep in mind that the offset applies separately to each edge and WAIT only directly connected replicas counts. For geo-replication, I set realistic latency budgets and measure offsets separately by region. A planned region failover is only justifiable if the next candidate region shows a minimal gap over an extended period and the network paths are stable. For long distances, I reduce write bursts, use pipelining sparingly, and increase backlogs at the nodes with the highest RTT.
Practical Operation in Hosting Environments
In a managed environment, I rely on clear Dashboards, which consolidate offsets, lag, and health metrics. For teams looking to speed up diagnostics, it’s worth checking out tools that offer deep Redis visibility and clear visualizations. This allows me to detect drifting offsets early and take corrective action before backlogs overflow or full syncs cause load spikes. In addition, I run failover tests in staging environments and measure how quickly offsets converge after a switchover. This guide provides me with a practical introduction to graphical analysis: Redis Insight for Diagnostics.

Troubleshooting Patterns as Lag Increases
When the offset gap increases, I follow a set of recurring patterns:
- Replica CPU at full capacity: Single-thread bottlenecks or resource-intensive Lua scripts slow down processing; I verify this by checking the processing rate and smoothing out spikes.
- Memory or I/O Pressure: AOF rewrites, snapshots, or noisy neighbors increase latency; I reschedule jobs, optimize storage classes, or enable diskless sync.
- Network path varies: Retransmissions, drops, or MTU mismatches; I check for interface errors and buffer sizes, and reduce packet loss.
- Replica Output Buffer: If the limit for replicas is set too low, the primary will disconnect; I set client-output-buffer-limit for replicas that match the load.
- TLS Overhead: On a weak CPU, encryption can slow things down; I measure crypto costs and either scale up the number of cores or offload the load using hardware acceleration.
- Diagnostic Tools with Side Effects: MONITOR or excessive logging slows things down; I use such tools sparingly and for a limited time.
I keep these patterns in mind within the team so that, when warning signs appear, we don't start from scratch, but rather quickly test and discard hypotheses.
Table Overview: Key Metrics at a Glance
I like to summarize the following overview during operations because it covers the most important Key figures and brings together promotions in one place.
| Signal | Meaning | Typical source | Action/Interpretation |
|---|---|---|---|
| master_repl_offset | Bytes generated by the primary in the replication stream | INFO replication | Baseline for lag calculation; monitor progress |
| slave_repl_offset | Bytes that the replica has already applied | INFO replication, Replica section | Subtract from master_repl_offset; determine the gap |
| Replication ID | Marker for the history/generation of the data | INFO replication | Combine with offset, check partial alignment |
| Backlog Size | Ring buffer for the most recent byte chunks | Configuration, INFO replication | Choose a larger size for high-volume writing |
| replication-offset (cluster) | Offsets per shard for primary/replica | CLUSTER SHARDS | Evaluate Shard Candidates for Switchover |
Summary: Mastering Offset, Avoiding Failures
I set the Offset I use this as a key metric to reliably manage consistency, partial syncs, and failover behavior. With INFO replication, an appropriate backlog size, and clean alerting, I keep replicated nodes tightly synchronized. In cluster topologies, I evaluate the offsets per shard and prioritize candidates with minimal lag. Tuning hz, network, and memory paths further reduces the backlog and prevents costly full syncs. Consistently monitoring offsets reduces downtime and significantly increases the reliability of the entire Redis stack.