Skip to content
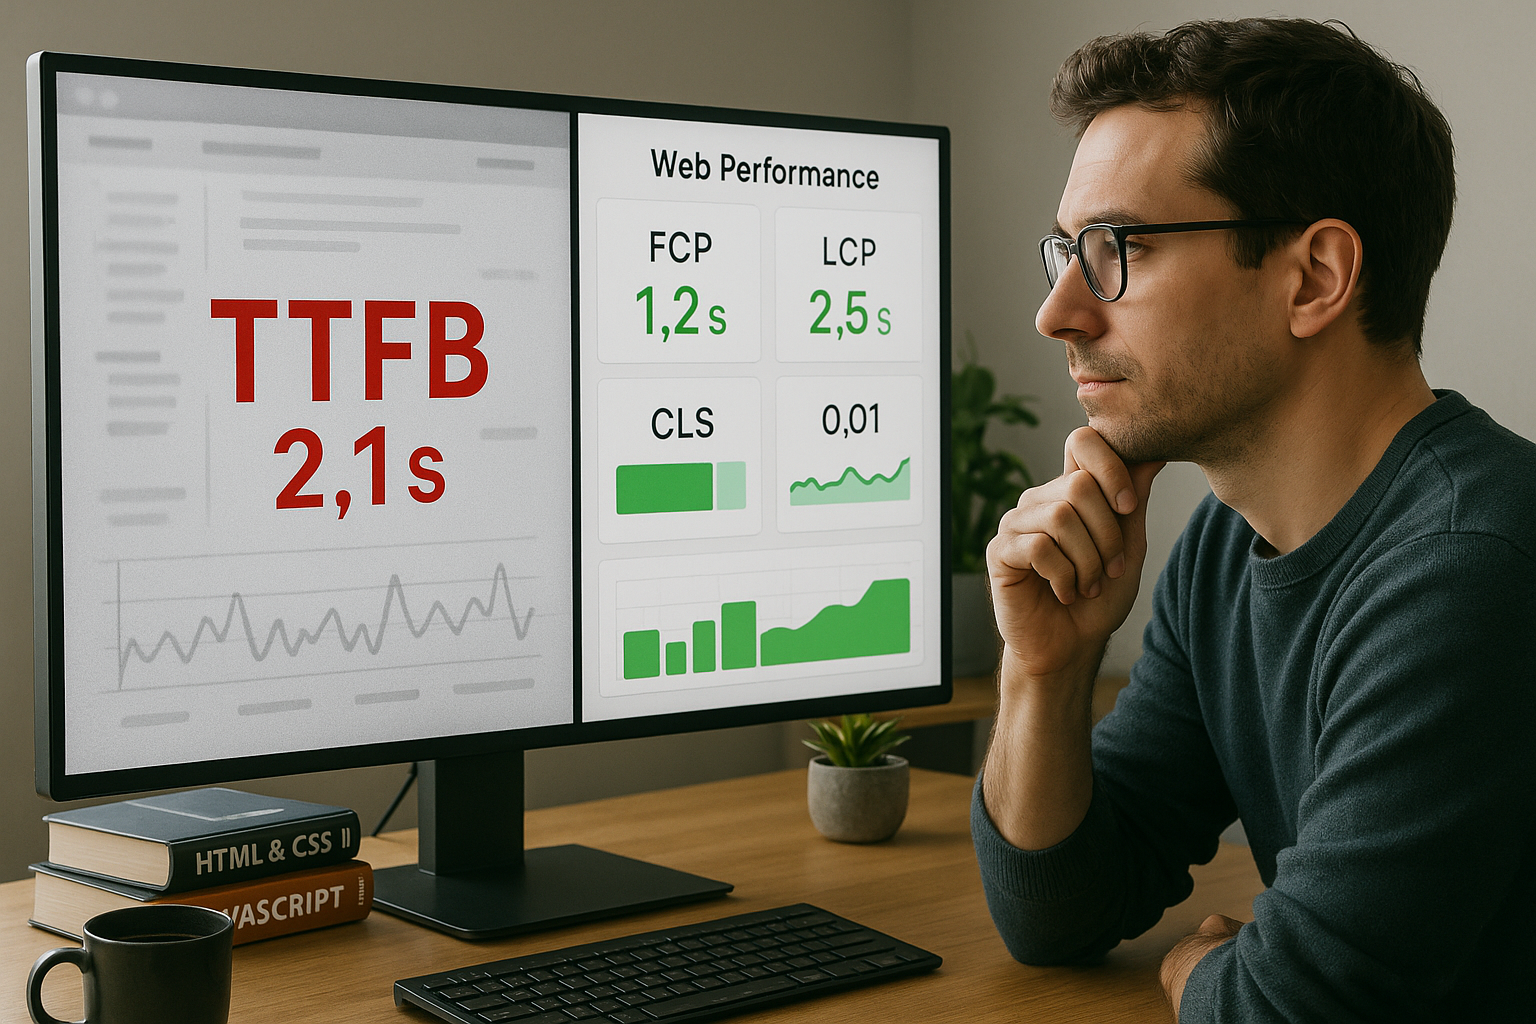
A well-founded TTFB analysis shows why the first byte timestamp is often misinterpreted and how I combine measurements with user metrics in a meaningful way. I explain specifically where misinterpretations occur, how I collect consistent data and which optimizations the Perception actually increase the speed.
Key points
- TTFB describes server start, not overall speed.
- Context instead of single value: Read LCP, FCP, INP.
- Location and network characterize measured values.
- Caching and CDN reduce latency.
- Resources and configuration have a direct effect.

TTFB briefly explained: Understanding the measuring chain
The TTFB maps the time from the request to the first byte returned and comprises several steps, which I call Measuring chain must be considered. This includes DNS resolution, TCP handshake, TLS negotiation, server processing and sending the first byte. Each section can create bottlenecks, which significantly changes the overall time. A tool shows a single value here, but the causes lie on several levels. I therefore separate transport latency, server response and application logic in order to Sources of error clearly assignable.
Optimize network path: DNS to TLS
I'll start with the name: DNS resolvers, CNAME chains and TTLs influence how quickly a host is resolved. Too many redirects or a high-latency resolver add noticeable milliseconds. Then the connection counts: I reduce round trips with keep-alive, TCP fast-open-like strategies and speedy port sharing. With TLS, I check the certificate chain, OCSP stapling and session resumption. A short certificate chain and activated stapling save handshakes, while modern protocols such as HTTP/2 and HTTP/3 multiplex multiple requests efficiently over one connection.
I also note the path: IPv6 can have advantages in well-connected networks, but weak peering routes increase jitter and packet loss. On mobile networks, every round trip plays a greater role, which is why I prefer 0-RTT mechanisms, ALPN and fast TLS versions. What is important to me is that transport optimization not only accelerates the TTFB, but also stabilizes the variance. A stable measurement span makes my optimizations more reproducible and decisions more reliable.
The 3 most common misinterpretations
1) TTFB stands for the total speed
A low TTFB says little about rendering, image delivery or JavaScript execution, i.e. about what people can do directly. See. A page can send a first byte early on, but fail later due to the largest content (LCP). I often observe fast first bytes with sluggish interactivity. The perceived speed only occurs when the relevant content appears and reacts. Therefore, a TTFB-fixed view couples the Reality of use from the measured value.
2) Low TTFB = good UX and SEO
I can artificially push TTFB, for example by using early headers, without providing useful content, which is what the real Utility value does not increase. Search engines and people value visibility and usability more than the first byte. Metrics such as LCP and INP better reflect how the page feels. A pure TTFB focus ignores the critical render and interactivity steps. I therefore measure in addition so that decisions can be based on Data with relevance.
3) All TTFB values are comparable
Measuring point, peering, load and distance distort comparisons that I could hardly make without the same framework conditions. Rate can. A test server in the USA measures differently to one in Frankfurt. Load fluctuations between morning and evening also change the results noticeably. I therefore use several runs, at least two locations and different times. Only this range provides a solid Classification of the value.

Synthetic vs. RUM: two perspectives on TTFB
I combine synthetic tests with real user monitoring (RUM) because both answer different questions. Synthetic gives me controlled benchmarks with clear frameworks, ideal for regression testing and comparisons. RUM reflects reality across devices, networks and regions and shows how TTFB fluctuates in the field. I work with percentiles instead of averages to identify outliers and segment by device (mobile/desktop), country and network quality. Only when patterns are found in both worlds do I assess causes and measures as robust.
What really influences the TTFB?
The choice of hosting environment strongly determines latency, IO and computing time, which is directly reflected in the TTFB shows. Overbooked systems respond more slowly, while NVMe SSDs, modern stacks and good peering paths allow short response times. The server configuration also counts: unsuitable PHP settings, weak opcache or scarce RAM lead to delays. With databases, I notice slow queries in every request, especially with unindexed tables. A CDN reduces the distance and lowers the Latency noticeable for static and cached content.
PHP-FPM and runtime optimization in practice
I check the process manager: too few PHP workers generate queues, too many displace caches from RAM. I balance settings such as max_children, pm (dynamic/ondemand) and request limits based on real load profiles. I keep Opcache warm and stable, reduce autoloader overhead (optimized classmaps), activate realpath cache and remove debug extensions in production. I move expensive initializations to bootstraps and cache results in the object cache. This reduces the time between socket acceptance and the first byte without having to sacrifice functionality.
How to measure TTFB correctly
I test several times, at different times, in at least two locations and form medians or percentiles for a reliable Basis. I also check whether the cache is warm, because the first access often takes longer than all subsequent accesses. I correlate TTFB with LCP, FCP, INP and CLS so that the value makes sense in the overall picture. To do this, I use dedicated runs for HTML, critical resources and third-party content. A good starting point is the evaluation around Core Web Vitalsbecause they are the Perception of the users.
Server timing and traceability
I also send server timing headers to make the time shares transparent: e.g. dns, connect, tls, app, db, cache. I add the same markers to logs and provide requests with trace IDs so that I can track individual runs via CDN, Edge and Origin. This granularity prevents guessing games: Instead of "TTFB is high", I can see if the database is taking 180 ms or the Origin is stuck in a queue for 120 ms. With percentiles per route (e.g. product detail vs. search), I define clear budgets and can stop regressions in the CI at an early stage.
Best practices: Faster first byte
I use server-side caching for HTML so that the server can deliver ready-made responses and the CPU does not have to recalculate every request. A global CDN brings content closer to users and reduces distance, DNS time and routing. I keep PHP, database and web server up to date, activate Opcache and use HTTP/2 or HTTP/3 for better connection utilization. I move expensive external API calls asynchronously or cache them so that the first byte doesn't wait idle. Regular profiling covers slow queries and Plugins which I defuse or replace.
Caching strategies in detail: TTL, Vary and Microcaching
I make a strict distinction between dynamic and cacheable. HTML gets short TTLs and microcaching (e.g. 5-30 s) for load peaks, while API responses with clear cache control headers and ETags can live longer. I use Vary selectively: Only where language, cookies or user agent really generate different content. Vary keys that are too wide destroy the hit ratio. With stale-while-revalidate I deliver immediately and refresh in the background; stale-if-error keeps the page accessible if the backend hangs. Important: Avoid cookies on the root domain if they unintentionally prevent caching.
For changes, I plan clean cache busting via version parameters or content hashes. I limit HTML invalidations to affected routes instead of triggering global purges. For CDNs, I use regional warmups and an origin shield to protect the origin server. This keeps the TTFB stable even during traffic peaks without having to oversize capacity.
TTFB vs. user experience: important metrics
I rate LCP for Largest Visible Content, FCP for First Content and INP for Input Response because these metrics are the experience noticeable make. A page can have a moderate TTFB and still appear fast if important rendering happens early. Conversely, a tiny TTFB is of little use if blocking scripts delay the display. I use the Lighthouse analysisto check the resource sequence, render path and priorities. This allows me to see which optimization is really Helps.

Set rendering priorities correctly
I make sure that critical resources come before everything else: Critical CSS inline, fonts with font-display and sensible preload/prioritization, images in above-the-fold with appropriate fetchpriority. I load JavaScript as late or asynchronously as possible and clean up the main thread load so that the browser can paint quickly. I use early hints to trigger preloads before the final response. Result: Even if the TTFB is not perfect, the page feels much faster due to early visibility and fast response.
Avoid measurement errors: typical stumbling blocks
A warm cache distorts comparisons, which is why I distinguish between cold and warm requests. separate. A CDN can also have outdated or non-replicated edges, which prolongs the first retrieval. I check the server load in parallel so that backups or cron jobs do not influence the measurement. On the client side, I pay attention to browser cache and connection quality to minimize local effects. Even DNS resolvers change the latency, so I keep the test environment as constant.
Consider CDN, WAF and security layers
Intermediary systems such as WAF, bot filters and DDoS protection can increase the TTFB without the origin being at fault. I check whether TLS termination takes place at the edge, whether a shield is active and how rules trigger complex checks. Rate limits, geofencing or JavaScript challenges are often useful, but should not shift the median values unnoticed. I therefore measure both edge hit and origin miss separately and have exception rules for synthetic tests ready to distinguish real problems from protection mechanisms.
Hosting decisions that pay off
Fast NVMe SSDs, sufficient RAM and modern CPUs provide the backend with enough Performanceso that responses start quickly. I scale PHP workers to match the traffic so that requests are not queued. The impact of this bottleneck often only becomes apparent under load, which is why I plan capacity realistically. For practical planning, the guide to Plan PHP workers correctly. Proximity to the target market and good peering also keep the Latency low.

Deployment and quality processes
I treat performance as a quality feature in delivery: in the CI/CD pipeline, I define budgets for TTFB, LCP and INP and block releases with clear regressions. Canary releases and feature flags help me to dose risks and measure them step by step. Before major changes, I run load tests to identify worker limits, connection limits and database locks. With recurring smoke tests on representative routes, I recognize deteriorations immediately - not just when the peak comes. This allows me to maintain the measured improvement in the long term.
Practical table: Measurement scenarios and measures
The following overview classifies typical situations and links the observed TTFB with further key figures and tangible Steps. I use them to narrow down causes more quickly and derive measures clearly. It remains important to check the values several times and to read context metrics. This prevents me from making decisions that only work on symptoms and do not improve perception. The table helps me to plan and carry out tests. Priorities to set.
| Scenario | Observation (TTFB) | Companion metrics | Possible cause | Concrete measure |
|---|---|---|---|---|
| First call in the morning | High | LCP ok, FCP ok | Cold cache, DB wakeup | Preheat server cache, maintain DB connections |
| Traffic peak | Increases by leaps and bounds | INP deteriorated | Too few PHP workers | Increase workers, outsource long tasks |
| Global access USA | Significantly higher | LCP fluctuates | Distance, peering | Activate CDN, use edge cache |
| Many product pages | Unstable | FCP good, LCP bad | Large images, no early hint | Optimize images, prioritize preload |
| Third-party APIs | Changeable | INP ok | Waiting time for API | Cache responses, process asynchronously |
| CMS backend update | Higher than before | CLS unchanged | New plugin puts the brakes on | Profiling, replacing or patching plugins |

Summary: Putting TTFB into context
A single TTFB value rarely explains how a page feels, so I link it to LCP, FCP, INP and real Users. I measure several times, compare locations and check load so that I get consistent results. For fast launches, I use caching, CDN, up-to-date software and lean queries. At the same time, I prioritize rendering the visible content because early visibility clearly improves perception. This is how my TTFB analysis leads to decisions that improve the Experience of the visitors.