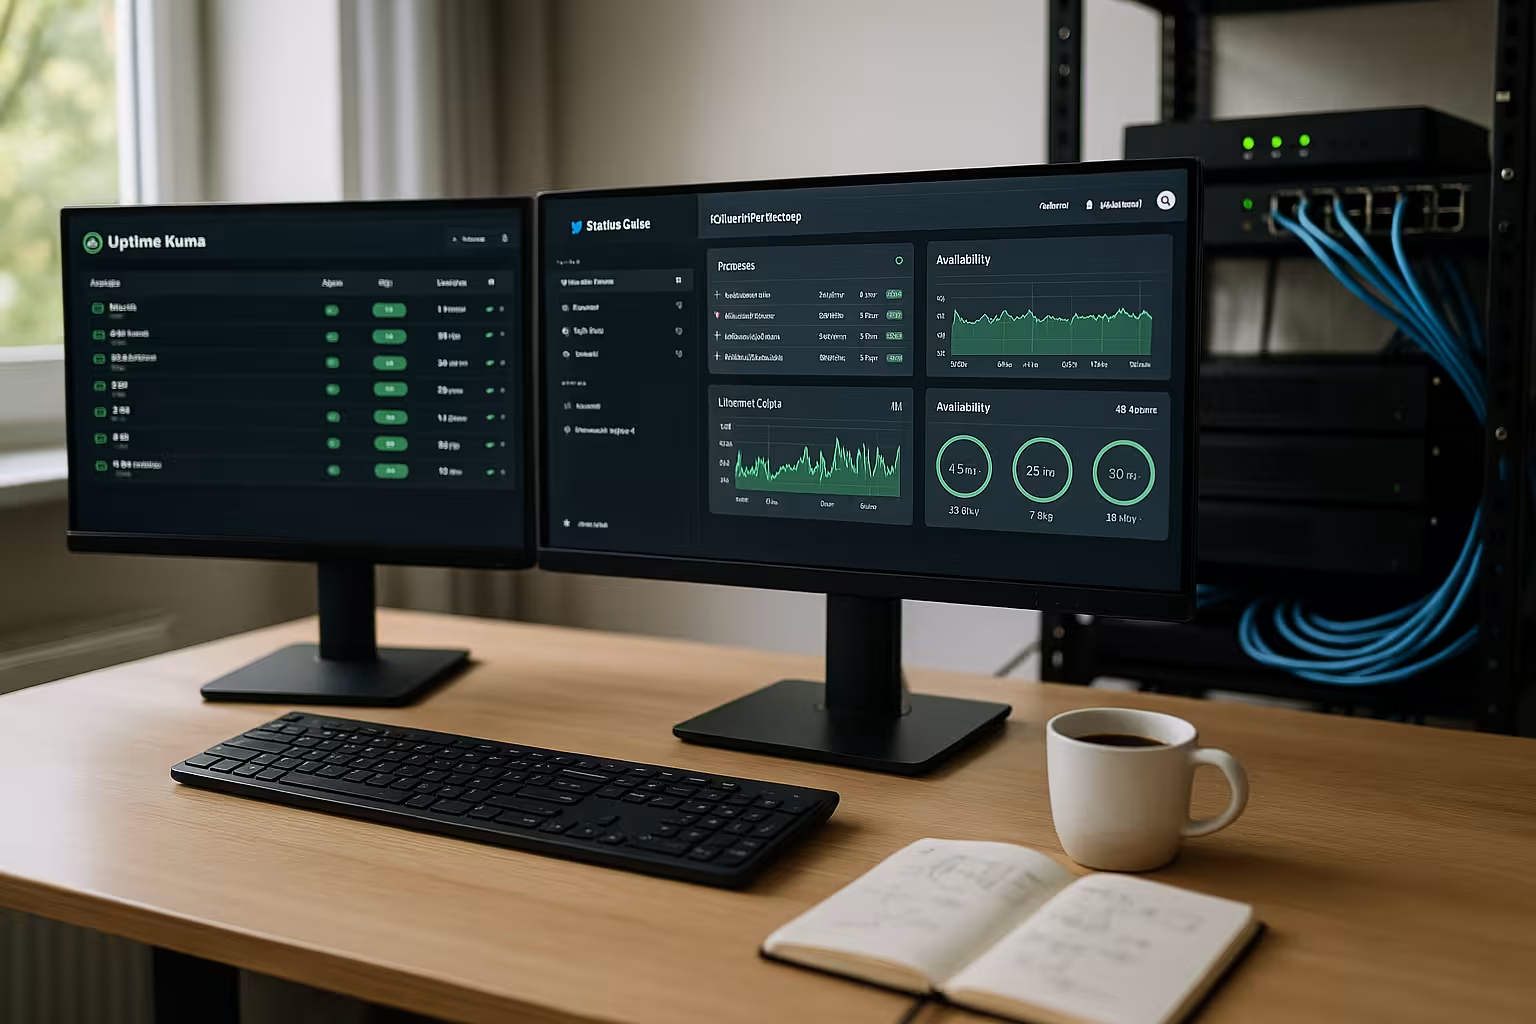
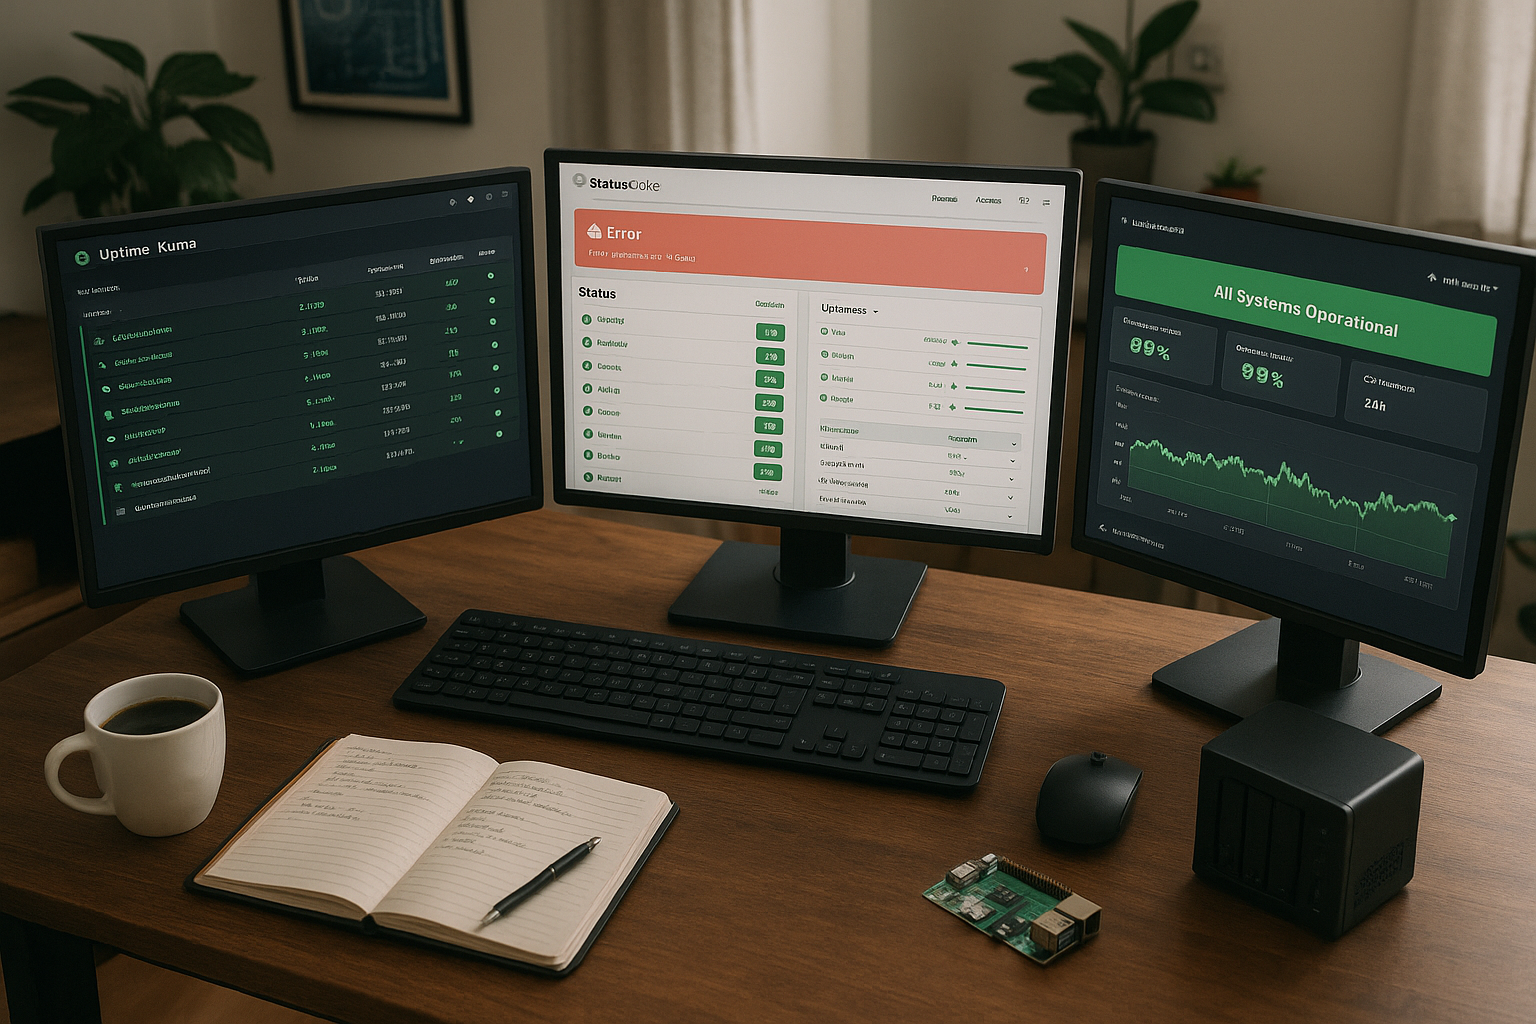
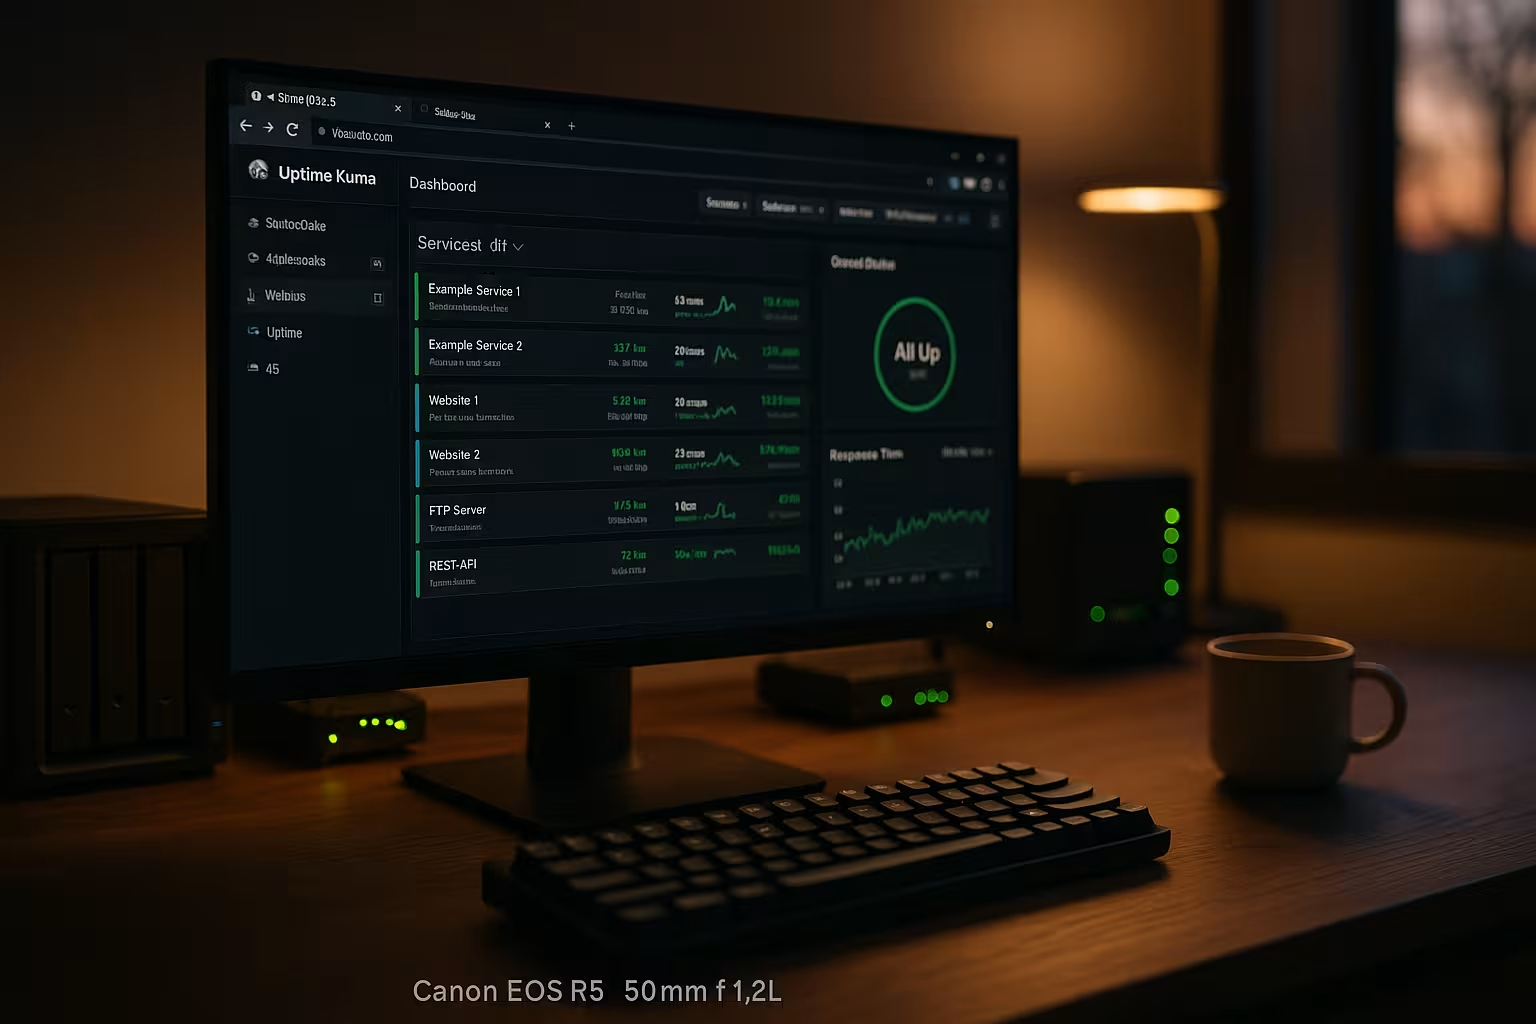
Uptime monitoring tools: Monitoring with Uptime Kuma, StatusCake & Co. for self-hosters explained, ready to use and practical. I show how uptime monitoring tools Report failures early, provide status pages and manage notifications cleanly.
Key points
As a self-hoster, I bear complete responsibility for Availability and performance. A good setup checks services at short intervals, reports errors reliably and provides clear statistics. Open source helps me to keep all data local, while SaaS provides global measuring points and many integrations. For small projects, I rely on simple checks; for teams, I need status pages and escalations. I make the choice based on my goals, my expertise and the Costs.
- Uptime Kumafull control, no ongoing fees
- StatusCake: global locations, strong alerts
- UptimeRobotquick start, free checks
- Better StackMonitoring plus incidents
- Pingdomdeep analytics for SaaS

Why Uptime Monitoring has self-hosters' backs
My own servers and websites sometimes go down, and that's exactly when I need a Alarm in seconds instead of hours. I check HTTP, ping, TCP or DNS, detect certificate errors and see trends over weeks. Early indications save money, keep customers and protect my image. Without monitoring, I'm looking for a needle in a haystack; with monitoring, I get to the root cause. The result is noticeable: less downtime, shorter response times and more Rest in operation.
What I specifically monitor: a short checklist
I define a clear set of tests for each service so that nothing slips through the cracks. It is important to test not only "is the port alive?" but also "does the service work for users?".
- HTTP(S) checks: Status code (200-299) and a keyword in the body so that a "Hello from CDN" does not accidentally pass as a success. I limit redirects and check whether the target URL is correct.
- SSL/TLS: Warn expiration dates in good time, check common name/SAN and recognize chain errors. An expired intermediate certificate will otherwise cause sporadic 526/495 errors.
- DNSA/AAAA records, NS responder and SOA serial. I monitor TTLs and domain expiry, because one missed entry can take entire projects offline.
- TCP portsDatabase (e.g. 5432/3306), SMTP/IMAP and internal services. I only perform external checks for publicly accessible ports; I check internal ports from the inside or via push.
- Ping/ICMPRough accessibility, to be interpreted with caution (firewalls often block ICMP). Nevertheless useful for "Is the host reachable?".
- Cron/job heartbeatsBackups, queue worker, importer. Each job "pings" an endpoint after success; if the heartbeat fails, I get an alarm.
- Business transactionsLightweight API checks (e.g. "/health" or a test search). I plan deep, multi-stage flows as synthetic tests in specialized tools.
- Third-party dependenciesPayment, email gateways or external APIs. I check simple endpoints or use their status websites as a signal source.
This is how I cover infrastructure and user experience. A simple 200 is not enough for me - I want to know whether "the right content" is coming and whether expiration data, DNS health and jobs are in sync.
Uptime Kuma: Open source with full data sovereignty
With Uptime Kuma, I operate my monitoring myself, keep my Data and reduce costs. The interface is clear, setup with Docker takes minutes, and I can control intervals down to 20 seconds. Checks for HTTP(s), TCP, ping, DNS and even containers give me broad coverage. I provide status pages publicly or privately, plus notifications via email, Slack, Telegram, Discord or PagerDuty. I see limits with team functions and support, but the community usually helps a lot fast.

StatusCake: Global measuring points and flexible alerts
For websites with an audience from many countries, I appreciate the Locations from StatusCake. Measuring points from over 40 countries help me to separate regional problems from real failures. Check intervals from 30 seconds, automatic verification and many integrations reduce false alarms and make onboarding easier. Status pages for customers, domain and SSL checks and server health round off the package. Pricing tiers open the door, but the deeper analytics tend to be in higher plans, which is something I've seen in planning and Budget take into account.
A brief portrait of UptimeRobot, Better Stack, Pingdom and HetrixTools
UptimeRobot convinces me as a low-cost entry with free checks, solid accessibility and Status pages. Better Stack combines monitoring, incident workflows and status pages, allowing me to manage incidents including escalation in one system. For large SaaS products, I use Pingdom because synthetic tests and real user data give me an in-depth picture of the user journey. I value HetrixTools for quick 1-minute checks and streamlined notifications via email, Telegram or Discord. In the end, what counts is which integration, which alerting and which Intervals are really needed.

Self-hosting, SaaS or hybrid?
I rarely make black and white decisions. In practice, I like to combine: Uptime Kuma runs internally with short intervals, sensitive checks and local notifications. I also use a SaaS service for a global view, SLA reports and out-of-band alerts (e.g. SMS) if my own network goes down. If my own monitoring instance fails, the external one reports - this is how I ensure Monitoring the monitoring from.
Hybrid sets priorities: Internally I verify database ports and heartbeats, externally I check the user journey via HTTP and DNS. This keeps secret endpoints protected and yet monitored, and I get an independent picture in the event of internet routing problems.
Comparison at a glance: Functions and fields of application
A clear overview of the most important factors helps me to decide Features. The following table summarizes free options, intervals, status pages, SSL/domain checks, alert channels and typical use. This allows me to quickly see which solution suits my own environment and where I need to cut back. Uptime Kuma offers maximum control, while StatusCake provides the strongest global nodes. Other services position themselves based on usability, team functions or Escalation.
| Tool | Free to use | Test intervals | Status pages | SSL/Domain | Alert channels | Typical use |
|---|---|---|---|---|---|---|
| Uptime Kuma | Yes | 20 sec - minutes | Yes | Yes | E-mail, Slack, Discord, Telegram | Full control for self-hosters |
| StatusCake | Yes (restrictions) | 30 sec - minutes | Yes | Yes | E-mail, SMS, Slack, MS Teams, PagerDuty | Agencies & teams with a global audience |
| UptimeRobot | Yes | 5 Min (Free) | Yes | Yes | Email, SMS, Slack, webhooks | Startups & smaller sites |
| Better Stack | Yes | 3 Min (Free) | Yes | Yes | Email, SMS, Slack, webhooks | Monitoring plus incident management |
| Pingdom | No | 1 min+ | Yes | Yes | E-mail, SMS, PagerDuty, Slack | Larger SaaS teams |
| HetrixTools | Yes | 1 min+ | Yes | Yes | E-mail, Telegram, Discord | Pro users with a fast cycle |
Who needs which tool? Decision according to use case
For a single page, Uptime Kuma or UptimeRobot is often enough for me, because I can install quickly and Costs spare. As a freelancer with customer projects, I appreciate StatusCake or Better Stack, as status pages, SMS and integrations help in day-to-day business. If I'm working deep in the DevOps environment, I use Uptime Kuma to secure data sovereignty and fine intervals on my own infrastructure. For international stores or magazines, global measuring points in StatusCake provide a turbo boost for error diagnostics. I get additional orientation in the Professional guide for monitoringwho structures my priorities and explains typical pitfalls.

Integration with hosting and WordPress
The best monitoring is useless if hosting and Server weaken. I therefore choose an experienced provider that offers impressive performance and availability and doesn't slow down monitoring tools. I connect WordPress via plugins, cron health and status pages, while alerts run via Slack, email and SMS. I monitor certificate expiry times centrally so that renewals happen on time. For a deeper insight into the load, I also use metrics and regularly look at Monitor server utilizationto alleviate bottlenecks in advance.
Automation and repeatability
I create reproducible configurations. I keep monitors, tags, notification paths and status pages versioned, export backups and restore them when moving. I briefly document changes so that I know later why a limit value was selected. In Teams, "Monitors as Code" pays off: New services automatically receive a set of HTTP, SSL and heartbeat checks plus routing to the right team.
It is also important that monitoring thinks along with deployments. Before releases I plan a short maintenance window, after releases I temporarily increase the check interval to see regressions early. If everything is stable, I switch back to normal mode.
Configuration: Intervals, escalation, keeping false alarms to a minimum
I like to recognize short intervals for critical services, but I balance Resources and accuracy. Two to three measuring points reduce false alarms before triggering an alarm. Escalation rules initiate silent notifications first, then SMS or PagerDuty if the failure persists. I enter maintenance windows so that planned work does not appear as an incident. A short Monitoring checklist helps me to keep intervals, alarms and status pages consistent.
I also avoid "alert storms" with confirmations and repetitions: A check is only considered "down" if two measurements fail in succession or at least two locations are affected. I set sensible timeouts (e.g. 5-10 seconds) and filter out transient errors without masking real problems. Keyword checks protect me if a CDN responds but delivers the wrong content.
Modeling dependencies helps with mitigation: If the upstream DNS is down, I mute child services so that I don't get fifty alerts. I work with tags per subsystem (e.g. "edge", "auth", "db") and route different severity levels to the appropriate team.

Notifications, rest periods and readiness
I make a strict distinction between warnings and alerts. I send warnings via Slack/email, critical failures are also sent by text message or to the on-call team. I take planned rest periods (nights, weekends) into account with escalation: anything that is not critical waits until 8 a.m.; P1 reports immediately.
- RoutingDefined channels and escalation levels per service/day so that the right team is reached.
- ThrottlingRepeated alarms within a short period of time are summarized and only renewed if the status changes.
- AcknowledgeAcknowledgement stops further notifications, but documents responsibility.
- PostmortemsAfter major incidents, I record the cause, impact, timeline and measures. This reduces repetitions.
I publish incidents transparently on status pages: start time, affected systems, workarounds and ETA. This reduces support tickets and increases trust, especially with agency or SaaS customers.
Practice: Uptime Kuma with Docker and notifications
For Uptime Kuma, I start a container, set a volume for Data and open the web port. I then create checks for the website, API, database port and DNS. For SSL, I check expiration dates and receive a warning in good time. I set up notifications via Telegram or Slack so that I can also respond on the move. I inform customers transparently on a public status page, while I release a second page internally for my team only.
In practice, I pay attention to a few details: I assign long, random tokens for heartbeat/push checks and activate two-factor authentication. I export backups regularly so that I can restart the instance if necessary. I set a short maintenance window before updates and watch the monitors more closely afterwards to avoid false alarms or regressions.
I use keywords sparingly and precisely ("unique-marker-123" instead of generic "Welcome"). For APIs behind WAF/CDN, I set my own user agent and suitable headers so that legitimate monitors are not blocked. And I give the checks descriptive names including tags - this saves seconds in the incident.
For internal services that are not allowed on the Internet, I use push/heartbeat monitors or I run a second Uptime Kuma instance in an isolated network. This allows me to monitor without opening ports and still keep the coverage high.
Security, data protection and communication
Monitoring itself must not be a risk. I only release the information that is really necessary: Status pages do not contain any internal host names, IPs or stack details. Accesses are given strong passwords and 2FA; I consistently remove old accounts. I rotate tokens regularly. I keep personal data flat in reports - uptime, error codes and timestamps are sufficient for most analyses.
For sensitive projects, I define who is allowed to see which data. Public status pages show the user perspective, while internal pages contain technical details and metrics. This is how I maintain transparency without oversharing.
Typical error scenarios and quick diagnosis
Many incidents are repeated in variations. I solve them faster with a small playbook:
- Sudden 5xx errorsFirst check deployments, then database connection, finally rate limits and WAF rules. A short rollback shows whether code or infrastructure is to blame.
- Only individual regions affectedSuspicion of routing/CDN. Compare regional measuring points, check DNS propagation, temporarily bypass nodes if necessary.
- SSL error despite valid certificateCheck intermediate certificates/chain, SNI correct? A client often only breaks with certain cipher suites.
- All green, but users still complainAdd content match, set load time thresholds and check the response size or certain keywords if necessary.
- Cron job did not runCompare heartbeat timeout, log extract and last runtime. Check schedules (cron) and authorizations, then escalation.
Key figures that control operations
I monitor uptime as a percentage, record Mean Time to Acknowledge and Mean Time to Recovery. I shorten throughput times from alerts to response with clear escalation chains. I evaluate error codes to separate 5xx from DNS errors and take targeted measures. I check whether outages occur at peak times and adjust intervals at these times. This is how I control my SLOs and keep my incident budget at a healthy level. Frame.
I formulate SLOs in measurable terms (e.g. 99.9 % per month). This results in my error budget of around 43 minutes. I consciously plan buffers for maintenance and calculate which intervals I can afford without breaking the budget. Reports by week and month help me to recognize trends: Recurring time windows, failures in deployments, slow drift in certificates or domain expiry.

Summary: Stay online without stress
With a focused setup of Checks, status pages and alerts, I keep services reliably connected to the network. Uptime Kuma gives me full data sovereignty and low costs, StatusCake scores with global measuring points and integrations. UptimeRobot, Better Stack, Pingdom and HetrixTools cover different scenarios, from simple start to enterprise. I define intervals, escalation paths and maintenance windows and keep false alarms to a minimum. If you honestly evaluate your goals and resources, you can quickly make the right choice and stay clear in your day-to-day work capable of acting.


