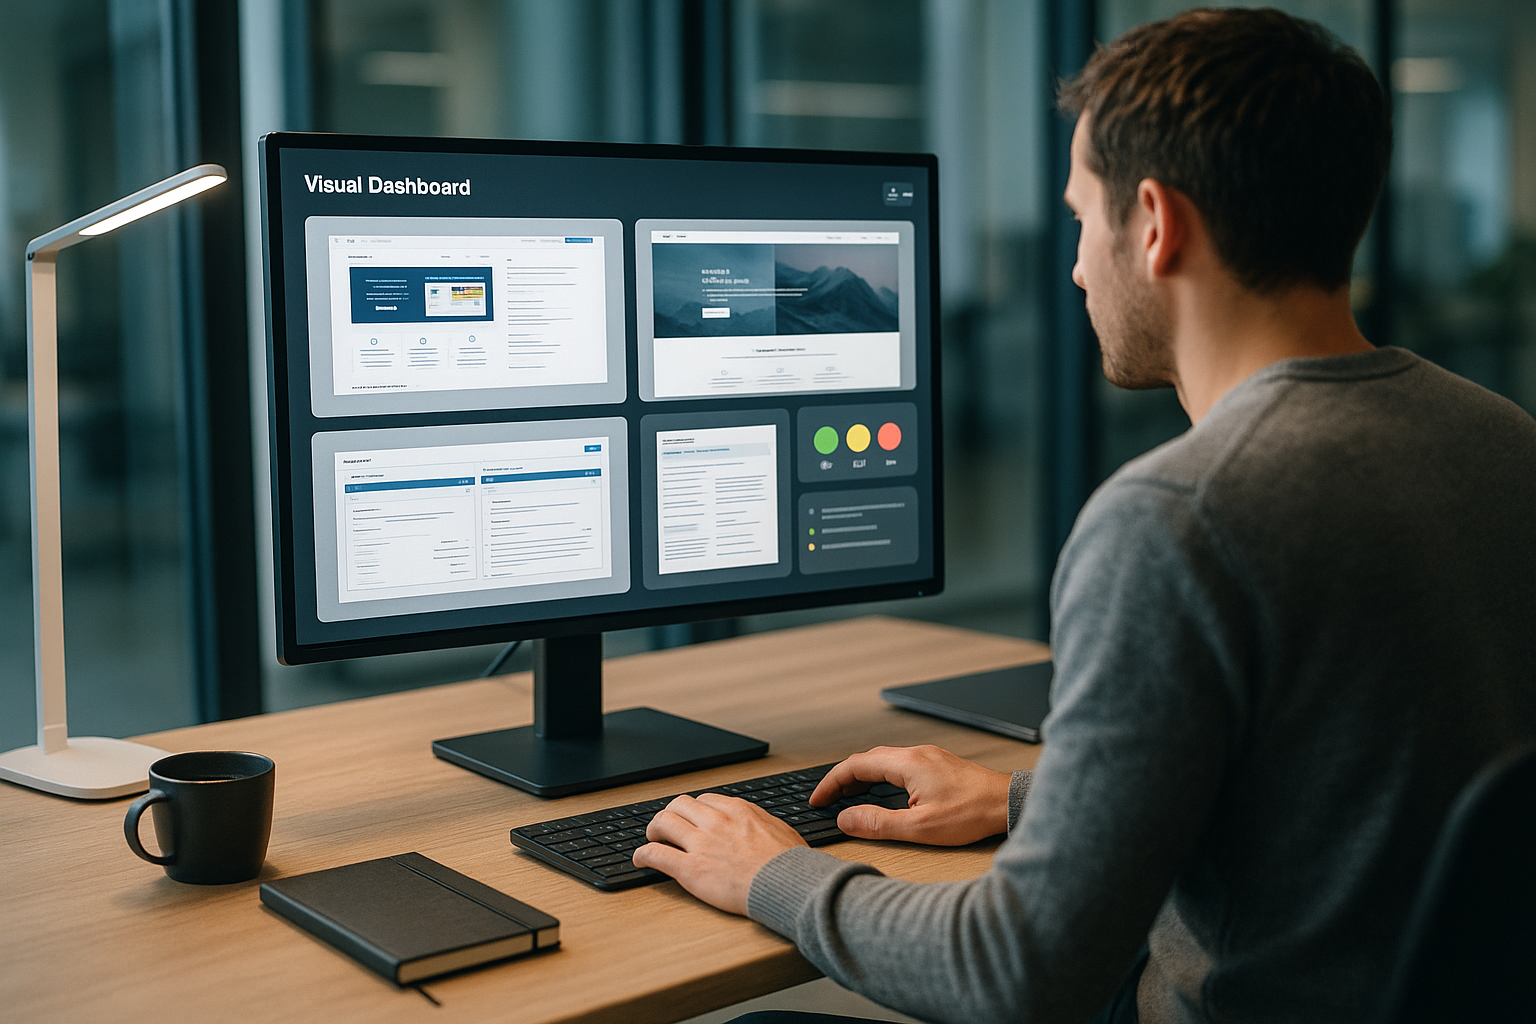
I show how Visual Monitoring Hosting reliably detects and documents visible errors with UI monitoring, screenshot tests and automated site checks. In this way, companies ensure presentation, usability and SLAs via visual checks that mirror real user views and Failures report early.
Key points
- UI monitoring checks visibility and click paths in real browsers.
- Screenshot tests compare target/actual states after deployments.
- Site checks simulate forms, logins and shopping carts.
- SLAs benefit from visual uptime documentation.
- Alerts warn of layout drift, overlaps and incorrect colors.

What does Visual Verification mean in hosting?
Visual Verification mechanically replicates the inspection goggles of the human eye and relies on automated Visual checks. I launch real browser instances, record the DOM status, check the render results and evaluate the visual integrity. This complements classic checks such as HTTP status, TTFB or CPU load, because the visible user interface is the actual Perception controls. Buttons, sliders, navigations and CTAs must appear, be clickable and react correctly, otherwise the service will be considered disrupted from the user's point of view. This is precisely where Visual Verification provides the crucial insight into what users really see and use.
Why visual monitoring counts today
Modern frontends are dynamic, responsive and strongly component-based, which makes the pure server uptime less meaningful and Error can be hidden. A green status does not help if a checkout button is behind a layer or font sizes are cutting off content. I therefore combine technical and visual checks to accurately detect layout drift, overlaps, incorrect colors and defective interactions. For performance aspects, I also use Performance monitoring because late reflows and blocking scripts move elements and create visual side effects. This combination increases the informative value of reports and enables SLA-suitable evidence.

Methods: UI monitoring, screenshot tests and site checks
UI monitoring
In UI monitoring, I check the graphical user interface at intervals or triggered by releases and validate clickable Elements Step by step. I open menus, fill in forms, trigger validations and expect defined feedback at the viewport. This allows me to recognize whether a cookie banner is blocking input, lazy loading is obscuring images or a modal remains open unintentionally. I also log console errors, network status and timing events in order to technically assign visual effects. The results are traceable Protocols with clear instructions for rectification.
Screenshot tests
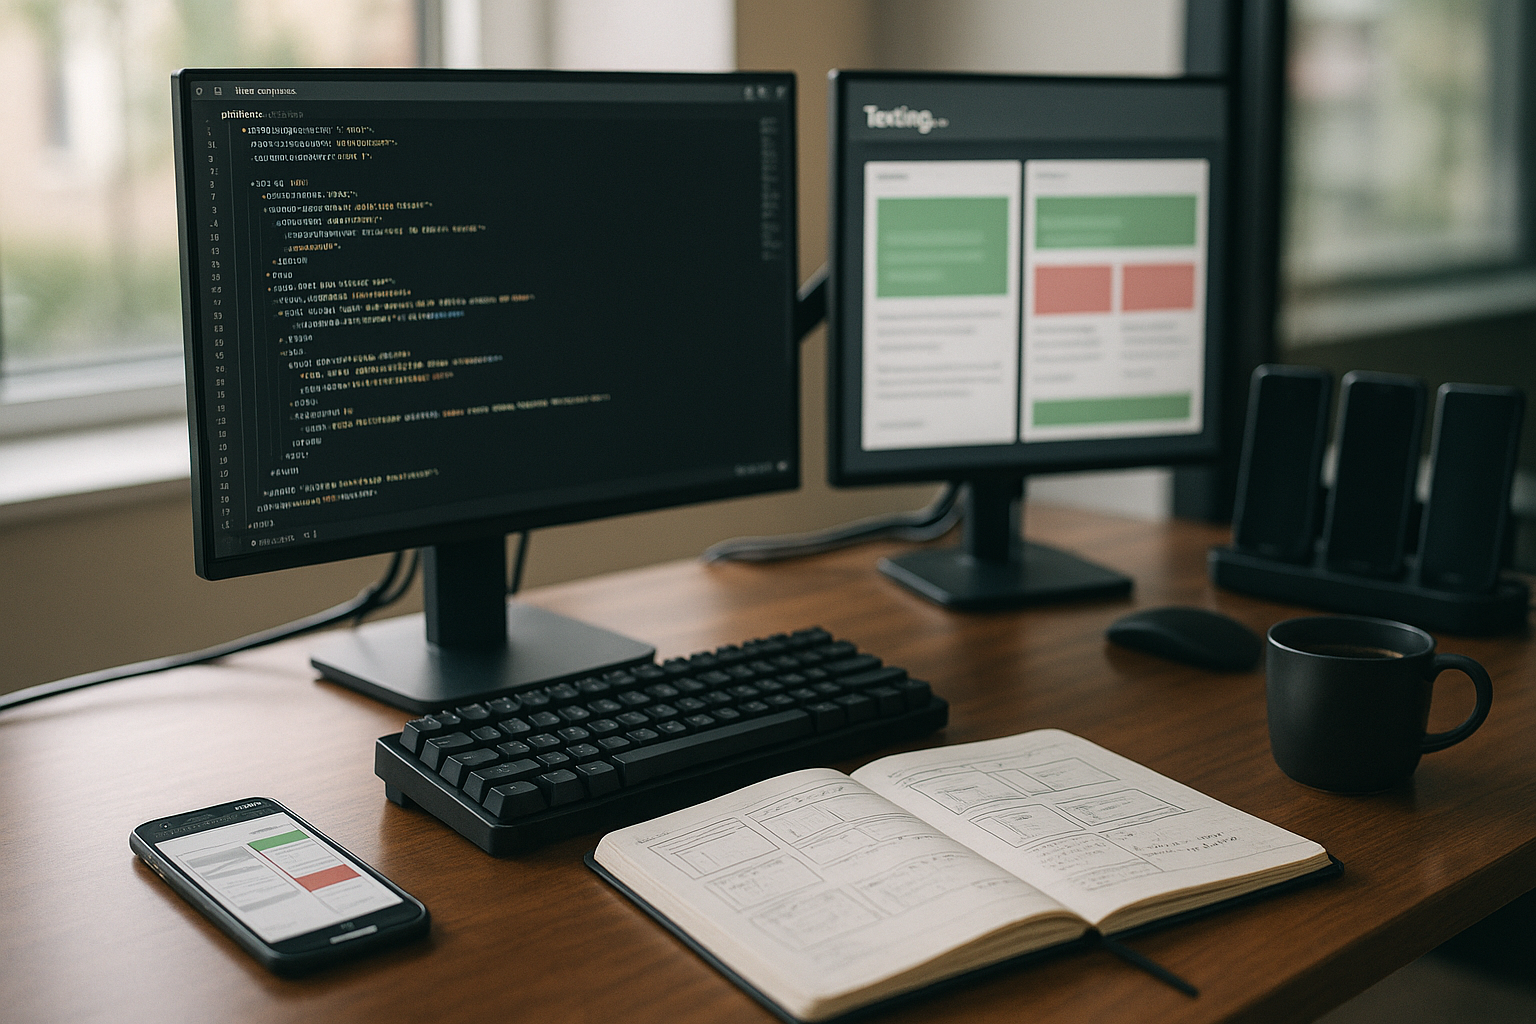
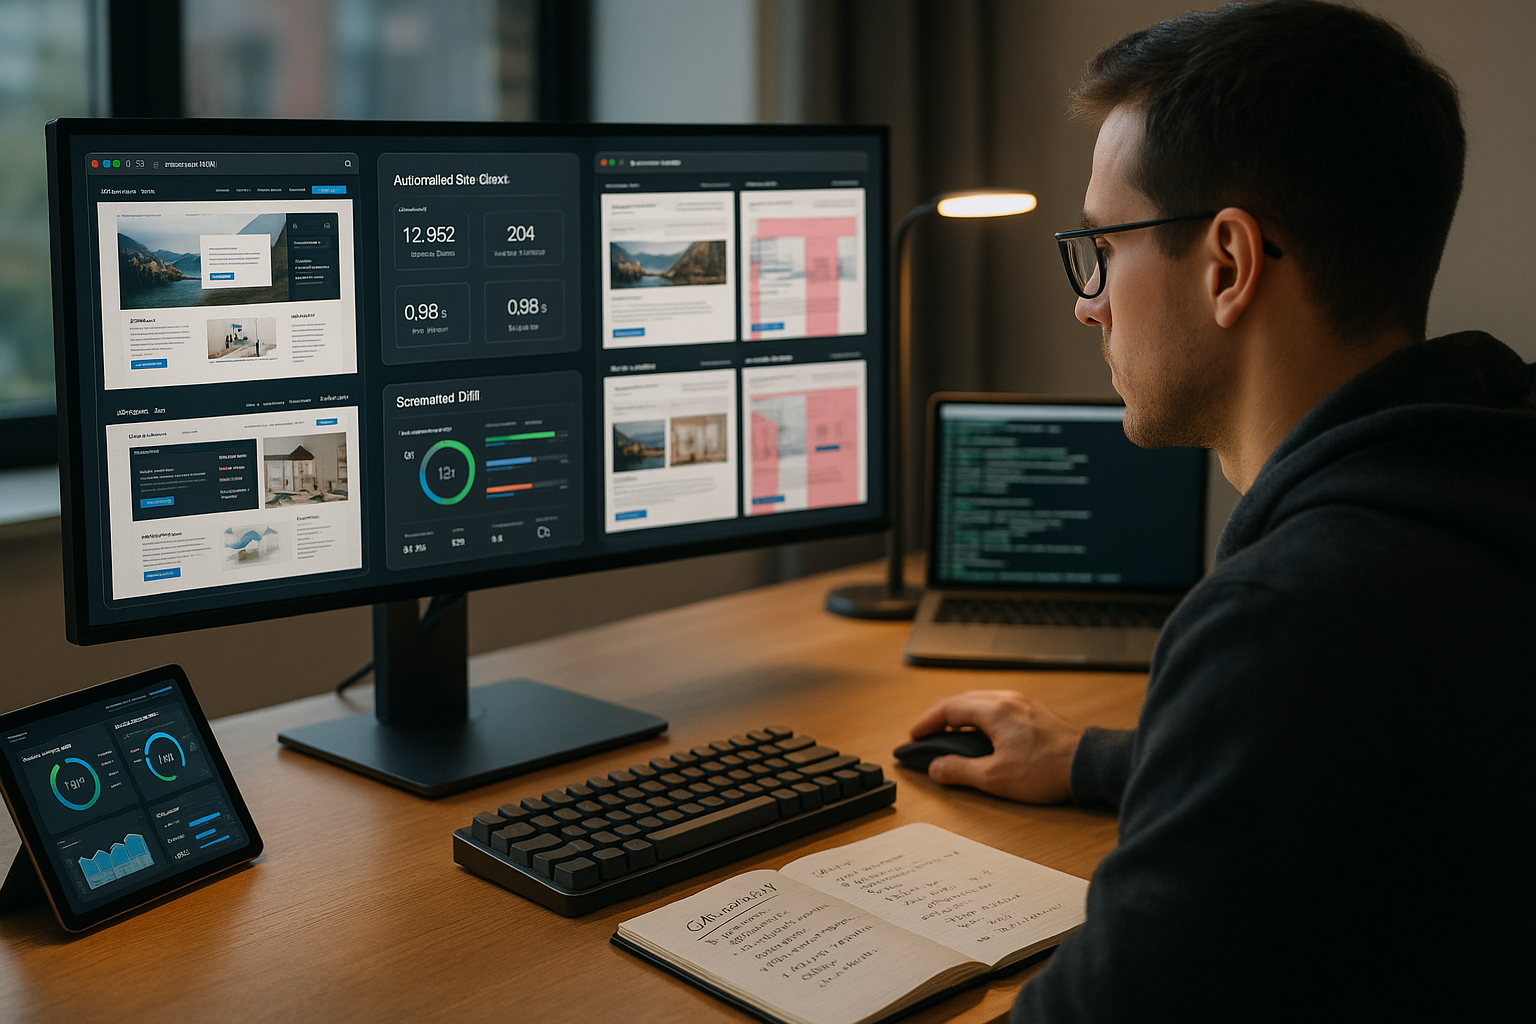
Automated screenshots capture target views for each breakpoint and compare them with the current state based on pixels or doms. I set tolerance rules for fonts, anti-aliasing and dynamic components so that no False positive things occur. I mark deviations in a differentiated way: Color, position, size, visibility or layering. Especially for campaigns, new translations or template rollouts, these comparisons provide quick certainty before going live. Every deviation is commented on, versioned and remains in the History available.
Automated Site Checks
Automated site checks run broadly across sitemap, main paths and critical workflows and form the daily Basic control. I simulate logins, password resets, checkouts or contact forms and monitor expected metrics. I also check metadata, structured data, consent status and tracking opt-ins so that reports are consistent later on. I summarize alerts according to severity so that teams are not overwhelmed by messages. This way, operators keep the Quality of the Journeys at a glance, without having to click manually.
Browser and device matrix
To ensure that visual results are truly representative, I define a clear browser and device matrix. I test the most important engines (Chromium, WebKit, Gecko) across common versions and take into account mobile devices with touch interactions, retina/high-DPI displays and different orientation positions. For responsive designs, I set breakpoints not only according to CSS media queries, but also according to actual usage proportions. Dark mode variants, reduced movements (Prefers-Reduced-Motion) and system fonts are also included in the baselines. In this way, I cover rendering differences that are decisive for users in everyday life.
Accessibility visually secured
I incorporate basic A11y checkpoints that can be visually validated: Contrast values, focus styles, visible error messages, sufficient target sizes and readability. At the same time, I check whether states such as hover, focus and active are not only semantically but also visually comprehensible. These checks help to detect accessibility regressions at an early stage, even if they do not directly lead to functional errors.
Uptime Screenshot Hosting: Make availability visible
Uptime Screenshot Hosting documents the actual visibility of the page cyclically, saves the image statuses and thus occupies the Service times for SLAs [2][1]. I use graduated intervals to monitor peak times more closely and handle quiet times efficiently. In the event of anomalies, I link directly to the affected screen statuses, including highlighting the deviations. This shortens error analysis enormously and provides support teams with a clear, visual data basis. Clients thus receive a transparent Proof instead of just numerical uptime percentages.
Multi-location checks and network reality
I monitor from multiple regions and networks to visualize DNS, CDN or routing effects. Throttling profiles (3G/4G/WLAN) simulate real bandwidths and latencies, allowing me to better evaluate late reflows, web font fallbacks and blocking assets. Different content banners, geo-content or regional A/B variants are specifically frozen or tested in separate run sets. In this way, I separate local disruptions from global problems and keep the evidence for SLAs robust.
Tool comparison: Solutions for visual verification and monitoring
Depending on team size, tech stack and budget, I choose solutions that reliably cover visual inspections and integrate well; the following table shows my compact Assessments.
| Rank | Tool/provider | Special features |
|---|---|---|
| 1 | webhoster.de | Comprehensive monitoring, automated UI, screenshot comparison, status pages, own visual monitoring service, simple integration, high Reliability [5][7] |
| 2 | UptimeRobot | Uptime screenshot hosting, specialized monitoring, intuitive operation, broad spectrum, good Price-performance ratio [2][4] |
| 3 | Site24x7 | Comprehensive solutions for large infrastructures, from basic to advanced monitoring [1][3], flexible Scaling |
| 4 | Datadog | Real-time monitoring, data visualization, advanced analysis, dense Dashboards |
| 5 | Zabbix | Open source, extensively customizable, strong community, deep Metrics |
| 6 | ManageWP | WordPress focus, central management of many sites, updates, Backups and reports |

Data protection, security and compliance
Visual checks create sensitive artifacts. I hide personal data in screenshots, mask fields (e.g. email, order numbers) and limit the retention period. I regulate export and access rights granularly so that only authorized roles can view screenshots. For audits, I log who has accessed which artifacts and when. Encryption in transit and at rest as well as clear data location (region, data center) are standard. In this way, visual monitoring remains compatible with data protection requirements.
Application examples from practice
In stores, I secure checkout paths via visual click sequences and check whether information on payment methods appears correctly and Buttons remain freely accessible. On company websites, I monitor contact forms, captchas, login gates and dynamic content. For agencies, I create branded status pages and weekly reports from screenshot archives. I track WordPress instances particularly closely after theme and plugin updates in order to report layout drift immediately. This keeps leads, sales and user journeys plannable and measurable.
SaaS vs. self-hosting at a glance
Depending on compliance requirements and team strength, I decide between SaaS and self-hosting approaches. SaaS solutions score points with low operating costs, scaling and a convenient UI. Self-hosting provides full data sovereignty, individual customization and integration into existing security controls. I evaluate network connections (outbound/inbound), headless farms, storage strategies for artifacts and role concepts. The aim: to strike a sensible balance between access, security and costs.
Cleverly mastering challenges
Dynamic content generates fluctuating states and therefore potential false positives, which is why I use placeholders, ignore zones and Tolerances set. Multilingual sites are given their own target screens for each language with clear rules for localization and content changes. For responsive layouts, I test defined breakpoints and check whether important modules are accessible everywhere. I seal CDN variants, feature flags and A/B tests on a test basis to ensure reproducible results. With this approach, reports remain Reliable, without concealing genuine errors.

Flake reduction and robust tests
To avoid fleeting false alarms, I rely on stable selectors (data attributes), explicit wait conditions, retries with backoff and deterministic test data. I selectively nudge network calls when external services jeopardize reproducibility without distorting the user perspective. I encapsulate time-dependent elements (tickers, animations) with pauses or ignore zones. This keeps the signal strength high while minimizing noise.
Measurable KPIs, thresholds and alarms
I define clear KPIs such as visual uptime, error rate per viewport, number of paths covered and average time to Recognition. I trigger alerts for deviations above the threshold value, such as 1% pixel difference in the above-the-fold area or blocked CTA areas. I also link layout signals with Core Web Vitals to illuminate visual problems from an LCP/CLS perspective. For in-depth analyses, I also use the Lighthouse analysis, which provides me with performance and accessibility data. Together, this results in a clean Control system for quality and prioritization.
Alerting and incident workflows
I route alerts to the right teams based on severity, context and affected journey. Deduplication, rest periods and maintenance windows prevent alert fatigue. Each rule refers to a short runbook with expected checks, logs and contact persons. I measure Mean Time To Acknowledge, Mean Time To Recover and the rate of irrelevant alerts. Linked with status pages and change logs, this creates a seamless chain from detection to resolution.
Setup steps: From zero to continuous control
I start with a list of target pages, prioritize critical paths and define expected states for each page. Breakpoint. I then create UI scripts for click paths, set up screenshot baselines and set tolerance rules. I configure alerts according to severity and link them to chat, email or incident tools. For self-hosters and teams with their own stack, I recommend taking a look at Uptime monitoring tools, which can be easily expanded. Finally, I document processes so that maintenance, handovers and onboarding smoothly run.

Change management and onboarding
I establish approval processes for new baselines so that design updates are adopted consciously and comprehensibly. Reviewers see the differences in context (viewport, resolution, path) and decide per element class. For new team members, I document conventions for selectors, naming, metrics and alert rules. This knowledge framework prevents uncontrolled growth and keeps maintenance costs low.
Integration in CI/CD and release trainings
I bind visual tests to pull requests, nightly builds and production-related staging environments and keep the Baselines separated per branch. Merge checks stop the rollout if defined deviations are exceeded. For hotfixes, I use targeted smoke tests so that critical views are secured immediately. I also tag every release version in the screenshot archive to make changes traceable. This ensures fast Decisions without long guesswork after deployment.
Baseline management and review gates
I keep baselines versioned and branch-specific. For large redesigns, I use staggered approvals per module to accept changes gradually. Drift statistics show which areas are frequently adapted and therefore need more stable selectors or tighter tolerances. This keeps the basis for comparison clean without slowing down the development frequency.
Costs, time and ROI
The running costs depend on the number of pages, test frequency and degree of parallelization and are often in the double-digit to low three-digit euro range per month, i.e. typically 30-250 euros per month. Euro. This is offset by saved downtime, fewer support tickets and shorter debug times. A single prevented checkout error can save days of revenue while the tools run reliably in the background. I document savings via metrics such as Mean Time To Detect, Mean Time To Recover and Conversion Impact. This makes the ROI visible and tangible for specialist and management teams.

Cost control in practice
I optimize runtimes via prioritization (critical paths more frequently, edge cases less often), parallelization as required and targeted triggers for releases. I control artifact retention in a differentiated way: In the long term, I only archive relevant snapshots (e.g. monthly or major release statuses), with a rolling window in between. Clear ownership per journey prevents duplication of work and distributes the maintenance effort fairly.
Best practices and anti-patterns
Data-driven selectors, small stable steps in click paths, test data factories and the separation of functional and display tests have proven their worth. I keep tolerances as tight as necessary and as generous as sensible. You should avoid hard sleeps, global wildcard ignoring and the uncontrolled acceptance of baselines after large changes. Equally critical are tests that recreate too much business logic and become brittle as a result - modular building blocks help here.
Checklist for the start
- Define goals: Journeys, KPIs, thresholds, SLA reference.
- Set matrix: Browser, devices, breakpoints, dark mode.
- Create baselines: clean stands, masking, tolerances.
- Building UI scripts: stable selectors, deterministic data.
- Set up alerting: Severity levels, routing, runbooks, maintenance windows.
- Regulate compliance: Masking, retention, access, logging.
- Connect CI/CD: PR gates, nightlies, smoke tests for hotfixes.
- Plan reporting: dashboards, trends, audit-ready evidence.
Briefly summarized
Visual Verification brings the real user view into the monitoring and makes layout, visibility and usability measurable. I combine UI monitoring, screenshot comparisons and site checks to detect errors quickly and document them reliably. On the tool side, providers such as webhoster.de, UptimeRobot and Site24x7 provide strong building blocks for everyday use and releases [5][7][2][4][1][3]. With clear KPIs, sensible tolerances and good alerting, the number of messages remains manageable and the benefits high. If you want to reliably prove visibility, usability and SLAs, you need well thought-out Visual Monitoring in the hosting context.


