Skip to content
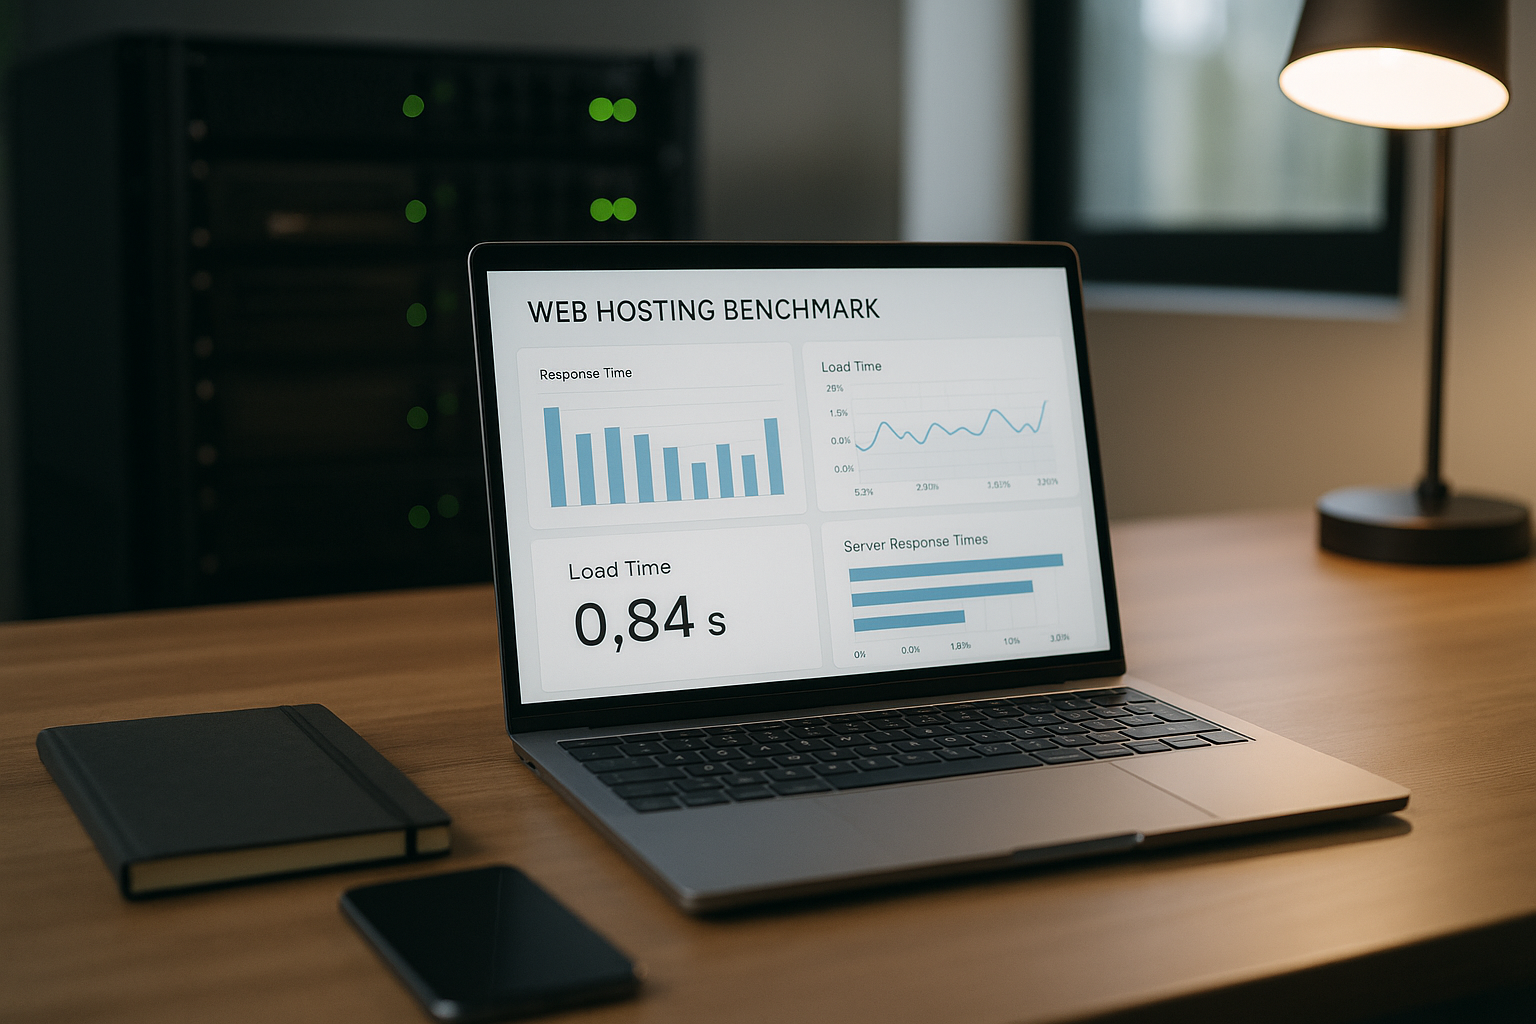
I'll show you how to use a webhosting benchmark measure the performance of your web space cleanly and compare it fairly. I check the CPU, RAM, I/O, database, network and uptime step by step, evaluate the measured values and derive concrete recommendations. Optimizations from.
Key points
- Core metricsCPU, RAM, I/O, DB, Latency, Uptime
- ToolmixWP Benchmark, Lighthouse, GTmetrix, Monitoring
- Test plan: Measure several times, vary times of day
- EvaluationTTFB, query latencies, find bottlenecks
- ActionOptimize, check tariff, compare providers
Why objective benchmarks count
Users expect short loading times and a available page - every second of delay costs interactions. I therefore not only measure the front-end speed, but also check the Server base yourself. Objective benchmarks uncover bottlenecks before conversion and visibility suffer. A clean test separates page code problems from hosting limits. This allows me to clearly see whether optimization or a change of tariff provides the greater leverage.
Measuring core metrics correctly
For CPU tests, I pay attention to the Single-Core-performance because many web processes run sequentially. I evaluate RAM measurements together with the Memory managementto categorize swap usage and cache hits. Sequential and random accesses count for I/O checks, as both affect web and database workloads differently. I assess databases using query times, connection establishment and index usage. I round off network latency, available bandwidth and uptime because low waiting times and a high Accessibility characterize the experience.

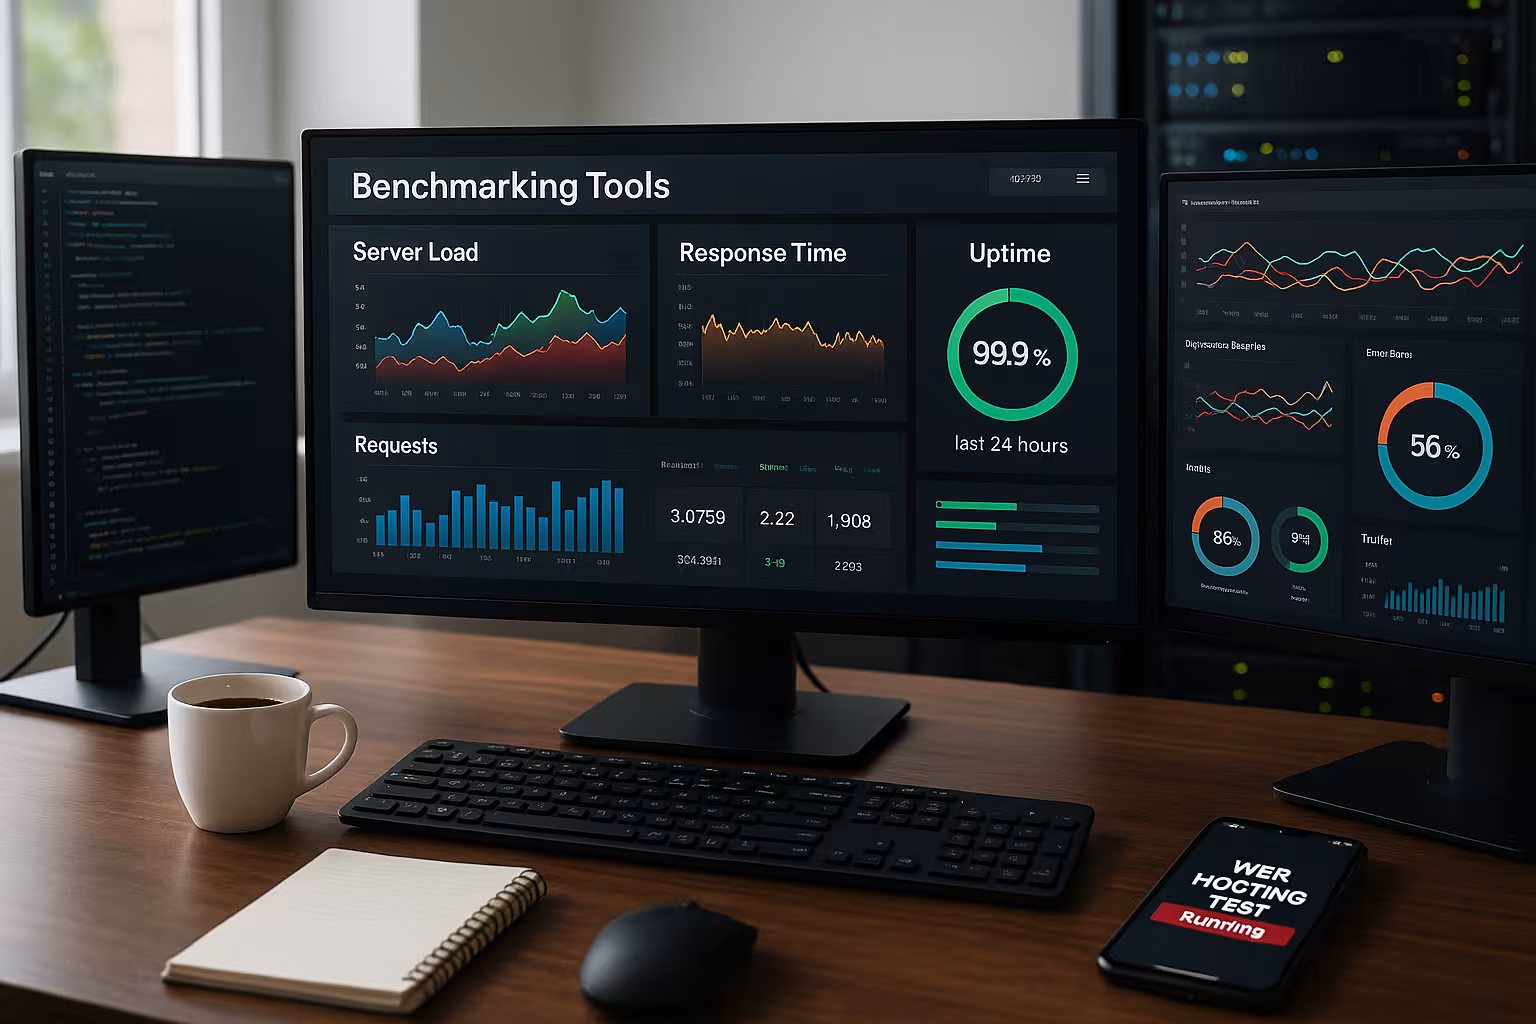
Tool overview: What I use
For WordPress I like to use the WP Benchmark plugin because it measures CPU, RAM, I/O and database directly in the dashboard. I do frontend checks with GTmetrix and Lighthouse to check TTFB, caching and the critical Rendering-path. Pingdom also provides me with a view of requests, headers and blockers. For availability, I set up monitoring with threshold values, alarms and trend curves. If you want to make a clean comparison between Lighthouse and PageSpeed, you will find a useful introduction here: Lighthouse vs PageSpeed.
Step-by-step: My test plan
I start with a basic run in the BackendCPU, RAM, I/O and database check. I then simulate calls to the most important pages and measure TTFB and loading time from several Regions. This is followed by repetitions in the morning, at midday, in the evening and at the weekend to smooth out any outliers. I document the results with screenshots, raw data and short notes. Finally, I compare front-end measurements with server data until cause and effect are clear.
Test hygiene and reproducibility
Clean benchmarks need consistent conditions. I therefore define a clear Baseline setup and document changes.
- Constant versionsFreeze PHP, web server, theme/plugins, database schema.
- Exclude disruptive factorsPause cronjobs, backups, virus scanners and image optimizers during the tests.
- Database: Real data size (contributions, media, users) or synthetic, but representative Samples.
- Measurement protocolNote the time, location, tools, caches on/off, concurrency and special events for each run.
- Warm vs. cold runsMeasure and mark both variants separately to make cache effects visible.
Define realistic test scenarios
I map benchmarks to real User journeysso that results are relevant to the business:
- Homepage, Category page, Article page
- Search/filter, form submit, checkout/payment page
- Dashboard/backend login and typical admin actions (e.g. save post)
I measure TTFB for every journey, P95 loading time, number of queries, transfer size and error rate. This allows me to recognize whether individual paths are out of line.
Plan load and stress tests correctly
In addition to individual calls, I test Parallelism and continuous load:
- Smoke1-5 users, 1-2 minutes - function check.
- Load10-50 users, 10-30 minutes - normal traffic level.
- Stresssuccessively up to the limit - At what point do errors/TTFBs increase sharply?
- Soak60-120 minutes of moderate load - do memory leaks or throttling occur?
I rate P50/P95/P99 for response times, error rate (HTTP 5xx), connection failures and CPU/RAM/I/O utilization. The point at which P95 and error rate tip over is critical - this is often where a worker or I/O bottleneck occurs.
Test caching layer correctly
Many hosts only shine with Page cache. I therefore separate:
- Page cache (static HTML output): with and without measurement.
- Object cache (e.g. persistent): Check hits/misses and effect on query time.
- Browser cache/CDN: regional effect, cache header, revalidation.
I consciously test non-cacheable paths (login, shopping cart) separately. For fairness, I only force cache buses or bypass (query strings/headers) where it makes sense.
Avoid measurement errors: Practical tips
I separate tests with and without Cacheso that I can see both cold and warm runs. I deliberately leave CDN, image optimization and script minification on or off, depending on what I want to check. I classify the network latency correctly and include server location and peering; this guide helps me to TTFB and latency. Multiple measurements and mean values prevent incorrect conclusions due to individual Spikes. I keep browsers, plug-ins and test devices constant to ensure consistent conditions.
Evaluating and interpreting results
With TTFB, I first check the Server timebecause it mirrors the backend before loading content. If the database shows unusual latencies, I look at indexes, query plans and the Connections. If the I/O rate drops under load, I interpret this as a storage system limit and check NVMe or better caches. If CPU peaks occur with slow PHP requests, I optimize the PHP version, opcode cache and worker. If everything points to the infrastructure despite clean code, I plan a tariff change.
From measured values to measures: Prioritizing with impact
I work my way from large to small levers:
- Large leversLocation/latency, PHP version, page/object cache, database indexes.
- Medium levers: Image sizes, critical CSS/JS, HTTP/2-Push vs. Preload, Keep-Alive.
- Fine tuningCompression, headers, micro-optimizations in templates.
I test every change isolated (A/B over time) and evaluate the net effect on P95 TTFB/charge time so that optimizations are not masked by side effects.
PHP, web server and worker settings
Many hosting limits are located in the Workers:
- Workers/ProcessesNumber and simultaneous requests; too few = queues, too many = RAM pressure.
- OPcacheEnough memory and validate settings for hot code paths.
- TimeoutsToo aggressive limits generate 504/503 under load.
- HTTP/2Multiplexing reduces blockages with many files.
I correlate worker utilization with P95 and error peaks to clearly assign bottlenecks.
Take a deeper look at the database
In addition to query duration, structural checks help:
- Index coverageIndex frequent WHERE/JOIN fields, avoid unnecessary full-table scans.
- Connection poolsConstant connection latency instead of constant reconnections.
- Buffer/cacheSufficient InnoDB buffer for working set.
- Slow queriesActivate logs, optimize top queries in a targeted manner.
I test repeatedly after cleanup/optimization to prove improvements and see regressions early.
Storage, backups and maintenance windows
IO dips at certain times often indicate Backup window or malware scans. I clarify schedules and deliberately create benchmarks outside - then I test once while of the window to know the effect. With split systems I observe Noisy Neighbor-effects and request throttling details (I/O, CPU seconds, process limits) if in doubt.
Correctly classify network variables
I measure from regions that correspond to my target groups and separate RTT clearly from server processing. I run CDN tests separately: once Origin-Directonce via CDN. This makes it clear what location and caching can do.

Scorecard: making results comparable
In order to compare providers/rates fairly, I carry out a Scorecard with weighted criteria:
- Performance (40 %): P95 TTFB, P95 load time, DB latency, I/O under load.
- Stability (20 %): Error rate, variance between times of day, throttling.
- Availability (15 %): Uptime, mean time to recovery, alarm response.
- Technology (15 %): Current stacks, caching, flexible limits, location.
- Economic efficiency (10 %): Performance per euro, scaling options.
I document raw values and calculate them to 0-100 points so that Trade-offs show transparently. A provider can be more expensive and still win if it delivers significantly better P95 times and stability.
Security vs. performance
WAF/firewall, bot filters and malware scanners are important, but can cause latency. I measure with activated Safety line and check whether exceptions (e.g. for static assets, health checks) make sense. I test rate limiting and captchas under synthetic load so that legitimate traffic is not rejected.
Background jobs, cron and queues
WordPress cron or queue workers generate load peaks (image generation, email bursts). I move these jobs to Windows with low usage and measure again. If benchmarks only look good without background jobs, I plan resources or job batching accordingly.
Adjust or change hosting tariff
If the CPU, RAM and I/O are only just right, I prefer to upgrade the Resources into consideration. For restrictive limits such as the number of processes or I/O locks, I switch to a plan with more generous limits. Boundaries. If the test shows high latencies outside my zone of influence, I choose a closer location. If support times and response quality are poor, I re-evaluate the provider. I base every decision on documented measurement series instead of gut feeling.

Technical selection criteria for fast environments
I pay attention to current PHP-versions (at least 8.2) and a modern web server stack such as LiteSpeed with HTTP/2. NVMe or SSD storage accelerate database and file accesses noticeable. A location in Germany or the EU shortens latencies for German-speaking target groups. Flexible resources prevent bottlenecks during traffic peaks. Clean security features and caches round off the overall package.
Set up monitoring permanently
After the benchmark, I leave the Uptime monitor constantly to detect failures and patterns. I inform myself of alarms so that I take them seriously and don't ignore them. Trend reports show me whether optimizations are really working or not. flatten. To get started with tools, metrics and notifications, I recommend this overview: Uptime Monitoring Guide. A reliable alarm plan saves a lot of time in an emergency.

Comparison 2025: a brief overview of providers
I look at uptime, technology, support quality and the Costs per month. The following overview summarizes the most important key data, based on publicly communicated performance features and typical starter tariffs. webhoster.de stands out with 99.99 % uptime, NVMe storage, GDPR-compliant servers in Germany and 24/7-support. For WordPress and growing projects, the combination of performance and price looks attractive. Nevertheless, I will only make a final decision after my own benchmarks on the target setup.
| Place | Provider | Uptime | Special features | Price from |
|---|---|---|---|---|
| 1 | webhoster.de | 99,99 % | NVMe SSD, DSGVO, 24/7 support | 1,99 € |
| 2 | SiteGround | 99,98 % | Global servers, WP optimization | 3,95 € |
| 3 | IONOS | 99,99 % | DDoS protection, intuitive operation | 1,00 € |
| 4 | Hostinger | 99,90 % | global, affordable, LiteSpeed | 1,49 € |
| 5 | Bluehost | 99,99 % | WordPress tip, simple operation | 2,95 € |
The table serves as Starting pointnot as a final judgment. I test every candidate with my stack because real load profiles differ. A short test run provides clear Data instead of promises. If you have important deadlines, check specific limits such as PHP workers, I/O and inodes beforehand. Only the measurement figures from your own hand decide.
Summary: How to check my web space
I'll start with a WP benchmark for CPURAM, I/O and database, then I measure TTFB and load time with GTmetrix and Lighthouse. I repeat the tests over several days and record the results clearly. I clearly assign bottlenecks to: code, cache, database, memory or Net. I then optimize the setup and check the tariff or change provider. Permanent monitoring keeps the quality stable and reports problems in good time.