 Skip to content
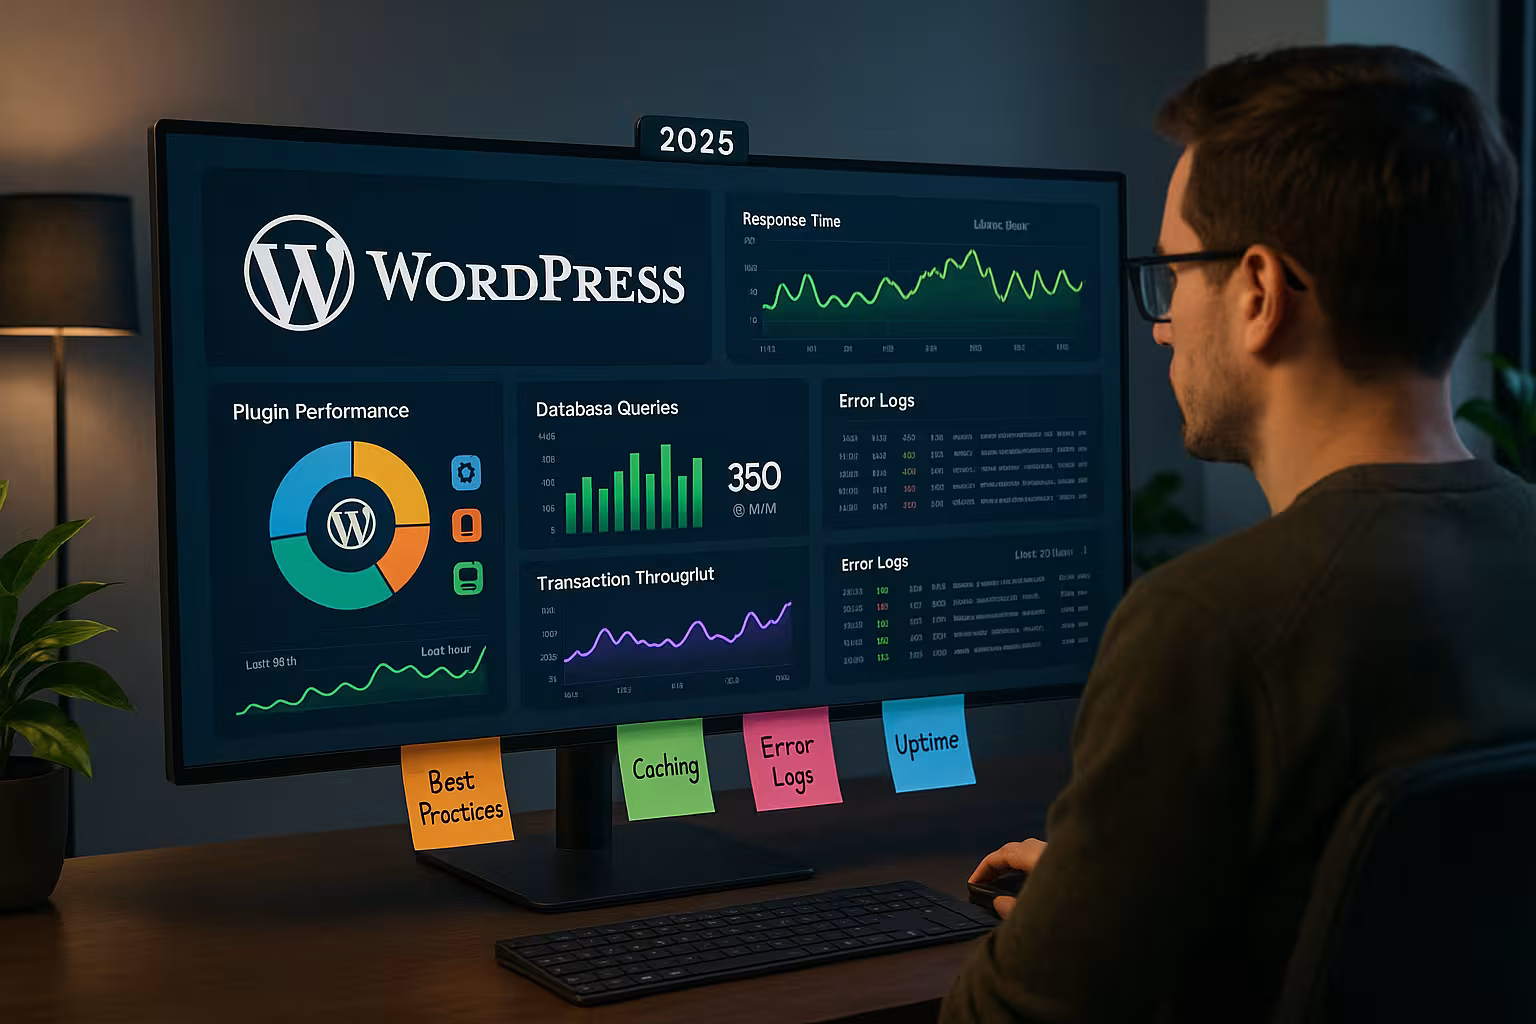
WordPress APM tools show me which components of my site are slowing me down in 2025 and provide metrics down to plugin, theme and query level. This allows me to make data-based decisions about which measures will have an immediate effect and which I can put on hold. Roadmap push.
Key points
The following key points summarize the most important statements of this article.
- Real time-measurements uncover bottlenecks in PHP, database and network and significantly shorten the error analysis.
- With Dashboards and alerts, I keep loading times, error rates and core web vitals under control in day-to-day business.
- I combine Tools for frontend (web vitals) and backend (queries, hooks) to avoid blind spots.
- The choice of Hostings and a clean release process have a greater impact on performance than individual tweaks.
- A fixed Workflow of measuring, changing and validating ensures fast pages and stable sales in the long term.

Why WordPress APM tools are indispensable in 2025
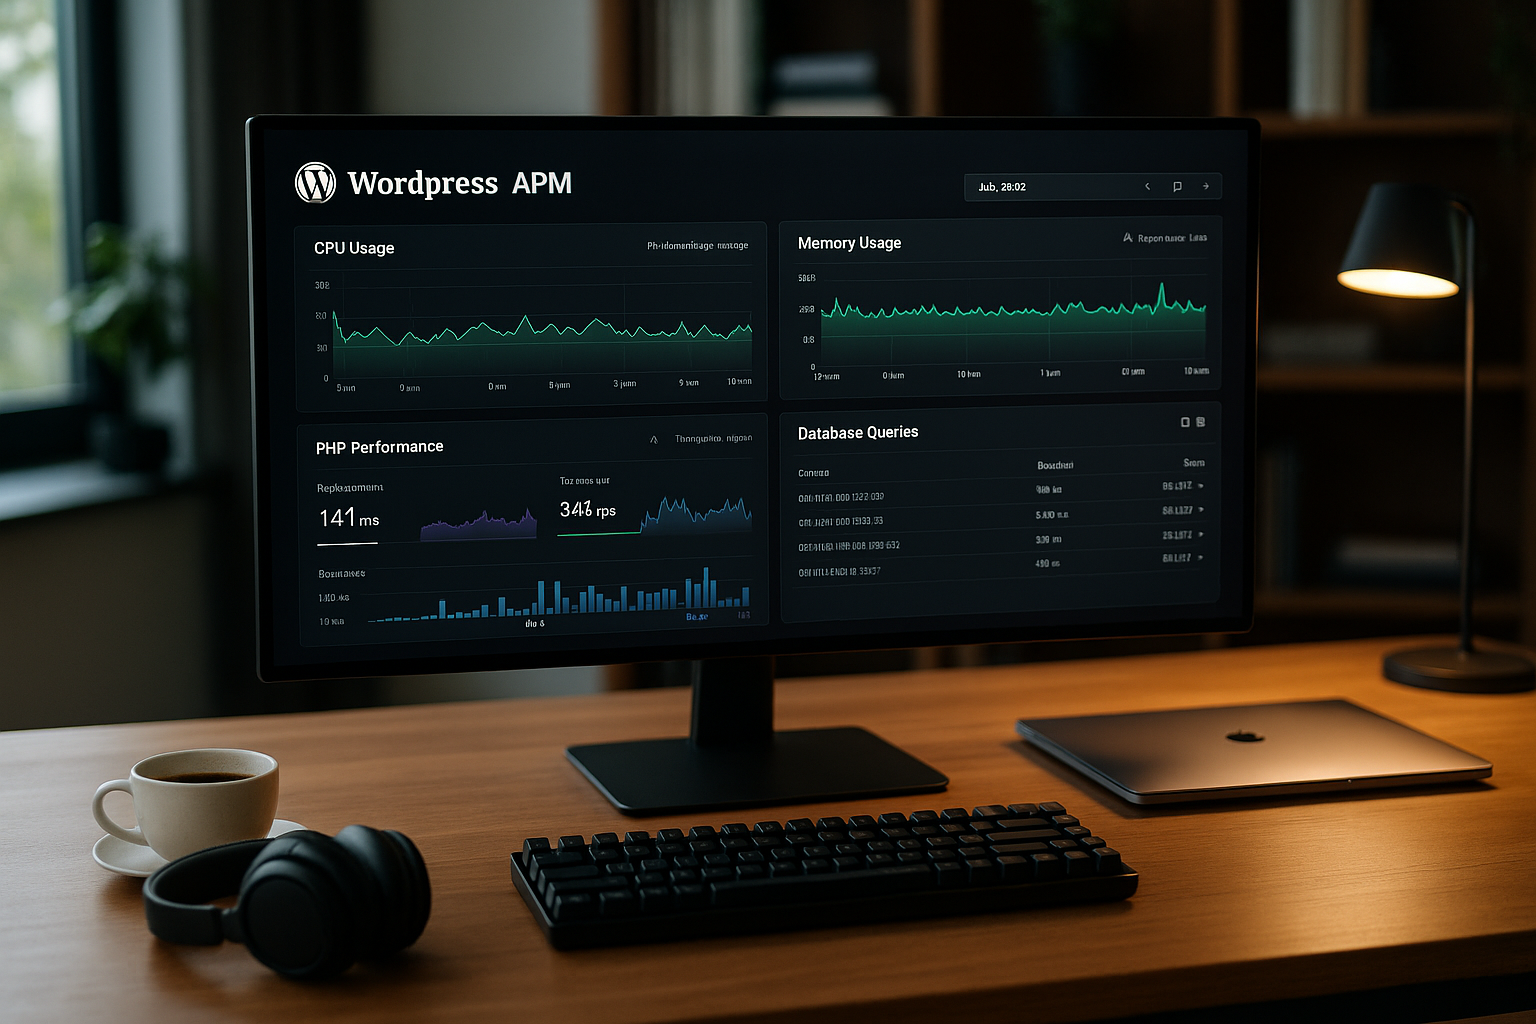
Performance influenced SEOsatisfaction and conversion - every delay costs measurable interactions. APM gives me near real-time insight into response times, PHP transactions, database queries and external services. This allows me to quickly identify bottlenecks and prioritize fixes according to their impact on users and sales. Without monitoring, I am left in the dark in the event of sporadic interruptions and react too late. An APM setup reduces the time to root cause and protects me from outages through proactive Alerting.
OpenTelemetry and targeted instrumentation
Out-of-the-box data is often not enough for me, so I supplement the automatic recording with my own Instrumentation. I name transactions consistently (e.g. route, controller, action) and set Spans around critical WordPress hooks like init, template_redirect or specific WooCommerce endpoints. I tag important attributes as dimensions: Environment, release, feature flag, user role (without personal data), cache hit/bypass, query count. A Correlation ID-header connects frontend requests, PHP, database and external APIs so I can see complete chains. I keep the overhead low by only instrumenting on the paths that really impact revenue or UX, and secure spans with try{}/finally{}-blocks against errors. This means that every measurement Comparable and results are reproducible - the basis for a reliable roadmap.
The most important metrics I measure every day
I start with server response time (TTFB) and the Core Web Vitals, because users feel these values directly and search engines evaluate them; this is where targeted measures have the greatest impact. Leverage effect. I then check PHP transactions, slow database queries, cache hit rate and external HTTP calls. The error rate and Apdex show me how consistent the experience is, even during traffic peaks. Session traces and samplings help to make sporadic timeouts reproducible. A clear target image with limit values prevents debates and directs measures towards reliable KPIs.
Avoid typical misinterpretations
Averages gloss over a lot of things. I always compare p95/p99 with median and sort outliers by path, device and country. Caching can conceal bad backends: good TTFB for hits says nothing about misses - I measure both separately. Synthetic tests show regressions early, real user data prove impact on the user. Sampling is distorted if only fast requests are recorded; I calibrate quotas per route and increase the depth specifically for problem cases. Important: Admin and cron place a different load on the infrastructure than visitor access - I keep these flows separate so as not to draw any false conclusions.

Tool overview 2025: strengths, costs, use
The following table summarizes the most common solutions, including rough euro prices for a quick overview. Classification. I round values sensibly and concentrate on the price-performance ratio for each use case. Cost alone says little; integration, visibility down to query level and a good workflow are crucial. Those starting out like to use free options and add more in-depth analyses later. Large setups need seamless tracing paths, reliable alerts and flexible Integrations.
| Tool | Price/plan (EUR) | Strengths | Suitable for |
|---|---|---|---|
| New Relic | Free & Premium from approx. €94/month | Real-time APM, WordPress hooks, plugin/theme analysis, broad integrations | Admins of large sites |
| Datadog | from approx. €14/month | Infrastructure, network and security monitoring, RUM, flexible dashboards | Company with many services |
| Kinsta APM | Included in hosting | Ready to use, WordPress-focused, fast error diagnosis | Kinsta customers |
| Middleware | from approx. €0.28/month | End-to-end, API tests, core web vitals, session replays | Tech teams |
| GTmetrix | free of charge (plugin) | Web Vitals, Waterfall, Lighthouse/PSI-Insights | Beginners & advanced |
| Query Monitor | free of charge (plugin) | Database queries, HTTP requests, PHP hints | Developer |
| FlyWP Uptime Monitor | 1 site free of charge, from approx. €1/site/month | Minute-by-minute checks, real-time notifications, error reports | Websites of any size |
| WP Umbrella | from approx. €1/month | Uptime, backups, maintenance reports, multi-site | Agencies & Freelancers |
| Jetpack Uptime | free of charge | 5-minute checks, global check, simple setup | Bloggers & SMEs |
I first test with free plans, validate metrics and then check whether an upgrade will improve my Goals faster to reach. It's all in the mix: Frontend checks, backend tracing and uptime monitoring complement each other. In this way, I keep risks to a minimum and focus budgets on real bottlenecks. If you measure cleanly, you save time and make better decisions. Decisions.
New Relic, Datadog, Kinsta APM & middleware in use
New Relic convinces me with deep WordPress insights down to hooks and plugin transactions, ideal for load peaks and tricky deployments; the learning curve pays off with clear Transparency from. Datadog integrates infrastructure through to security and is suitable for environments with many services in which I want to map end-to-end chains. Kinsta APM delivers quick results for hosting customers without additional effort - perfect for recognizing anomalies directly in the dashboard. Middleware scores with session replays and API tests, which combines error images with user context. I also monitor load peaks via Monitor server utilizationto clearly separate bottlenecks between CPU, I/O and PHP workers. Rate.
Making caching strategies measurable
Cache only works if I use its Hit rate know. I separate full-page cache (Edge/Server) from object cache (Redis/Memcached) and log hits/misses per route. WooCommerce often sets cookies that exclude pages from the cache; I minimize bypasses with targeted Vary and fragment dynamic parts (ESI/fragment cache) instead of excluding the whole page. In APM I see how TTFB and PHP time behave with misses and whether preloading/warmup really helps. I check TTL at CDN level, stale-while-revalidate and error TTL, so that users also get quick answers to original hangs. I monitor transients separately: they are no substitute for a persistent object cache - I measure their accuracy and clean up zombie entries.
Frontend vs. backend: GTmetrix, Query Monitor and co.
GTmetrix shows me web vitals, waterfall and render paths, which allows me to prioritize blocking scripts, fonts and images; this brings fast Profits on landing pages. Query Monitor runs in the admin and uncovers slow queries, duplicate hooks, REST calls and PHP hints. Both tools complement APM: one looks at the actual user, the other at the inside of the application. This allows me to rule out misinterpretations, such as when a caching hit obscures good times or a plugin only slows down on certain routes. This combination saves me debugging time and contributes directly to stable Loading times with.
Fixing database bottlenecks in a structured way
I discover most bottlenecks in a few patterns: missing Indices at postmeta/usermetaexpensive LIKE searches, large JOINs about unstructured metadata and too many autoload options. I measure query times per route, check lock wait times and look at the size of autoloaded_options anything over 1 MB is a red flag. WooCommerce often benefits from targeted indexes on order and meta tables or from switching to HPOSbecause this makes query profiles clearer. Instead of blanket optimizations, I change queries where traces show real costs: Pagination, price filter, search, checkout. I compare each change with an identical load; only when p95 times fall and locks become less frequent is the fix ready for production.
Background jobs, cron and queues
Many spikes do not originate from the user, but from WP-Cronimports, indexers or webhooks. I measure these flows separately, switch cron to a system cron and limit parallel runs. I move heavy work to queues or asynchronous processes with small batches so that PHP workers remain free. APM helps me to choose batch sizes and intervals so that p95 latencies of the user paths remain stable. admin-ajax.php and the Heartbeat API - they often cause avoidable noise in the backend. I store my own transaction names for CLI jobs so that I can filter and separate them in dashboards. alerted can.
Uptime, backups, alarms: operational monitoring strategy
Performance without availability is of little use, so I keep uptime checks and backups closely interlinked. FlyWP notifies me of outages within a minute, including status codes and error details, which makes the Cause more quickly. WP Umbrella brings together several sites in one view and creates reports that I pass on internally or to customers. Jetpack Uptime is a lean option for small projects and complements security functions. Clean alerting remains crucial: clear threshold values, suitable channels and quiet Escalations instead of a flood of alarms.

Best practices: My process for quick success
I set target values for TTFB, LCP and error rates and check deviations on a daily basis; without a target, any discussion is a waste of time. Fog. I roll out changes small, measure and compare before/after in the identical time window. Particularly effective: database indexes, object-based caching and streamlining heavy plugins. For larger projects, I start with a structured Performance audit and then work through the backlog with the highest impact first. Every fix ends with monitoring, so that I can immediately detect regressions. recognize.
SLOs, error budgets and alarm hygiene
I work with SLOs instead of individual metrics: e.g. 99.9% availability per month, LCP ≤ 2.5 s for 95% of sessions, p95 TTFB ≤ 200 ms on key routes. I derive error budgets from this and use Burn rate alertswhich report short, severe violations immediately and also detect long-lasting leaks. Alerts only fire on consistent deviations and are time-delayed to keep teams focused. Each alert playbook contains clear steps: who to inform, which dashboards to check, how quickly to escalate, when rolling jaws. This creates peace and quiet - even during traffic peaks.
APM in practice: Procedure for deployments and updates
Before a release, I record baselines under load, because real load shows the truth. Then I activate feature flags or blue-green, monitor dashboards and quickly clamp down on outliers; short rollback paths save real Costs. I test updates of themes, plugins and core in staging with identical data, including synthetic checks and selected real user subsets. After the go-live, I check metrics closely for the first 24 hours and only then increase the rollout. This rhythm prevents surprises and keeps my team in a calm, reproducible rhythm. Process.
APM for WooCommerce and dynamic pages
E-commerce sites have higher requirements because the shopping cart, checkout and search generate many dynamic calls. I measure separate transactions here, track cache bypasses and check third-party calls from payment, shipping and tracking. The REST API deserves special attention: I optimize routes with high frequency first and keep payloads small. For in-depth analyses, I use structured traces and targeted profiling along the purchase route. A focused REST-API performance-analysis often brings quick success in the checkout and significantly reduces abandonment.
Correctly interpreting PHP-FPM, OPcache and server settings
Many symptoms lie in the Runtime environmenttoo few PHP workers, missing OPcache, scarce RAM or aggressive timeouts. I correlate APM peaks with FPM metrics (queue length, max_children, CPU), track OPcache hit rate and do not invalidate unnecessarily during deployments. With FPM I prefer pm.dynamic with sensible reserves; pools that are too small create queues, pools that are too large lead to I/O and memory pressure. At web server level, I check keep-alive, Gzip/Brotli and limits for uploads/time-outs. On the database side, I monitor buffer pool sizes, I/O wait times and slow query logs - all neatly linked to the APM traces so that cause and effect remain clear.
KPIs, thresholds and dashboards that save me time
I keep LCP under 2.5 seconds, TTFB under 200 milliseconds and the error rate under one percent; clear Boundaries create clarity. Apdex helps me to evaluate user satisfaction across sessions. For the database, I set time targets for queries and monitor lock wait times, because blockages are often hidden behind good average values. I organize dashboards along user journeys, infrastructure and services so that causes become visible more quickly. Alerts only fire when there are consistent outliers, avoid noise and draw attention to real issues. Problems.
Data protection and cost control in monitoring
I only record what I really needand consistently mask sensitive data (email, IP, order numbers). I reduce RUM events to technical signals and rough geodata; all IDs are hashed or pseudonymized. To control costs, I use differentiated Samplinghigh rate for checkout and API, lower rate for static pages. I define retention per data type - errors longer, high-cardinality logs shorter. I deliberately keep tags small (release, environment, route) to avoid cardinality. This keeps dashboards fast, invoices calculable and the DSGVO-conformity is maintained.
Briefly summarized: My APM roadmap 2025
I use WordPress APM tools to treat causes rather than symptoms and direct investments towards the greatest effects. The path remains clear: measure, prioritize, roll out, validate - and everything under continuous observation. Free plugins get you started, in-depth APMs ensure transparency for growth and traffic. With clear goals, strong alerts and a lean release process, I reduce risk and keep sites permanently up and running. fast. This keeps users satisfied, rankings stable and sales predictable - without guesswork, but with clear Structure.


