Skip to content
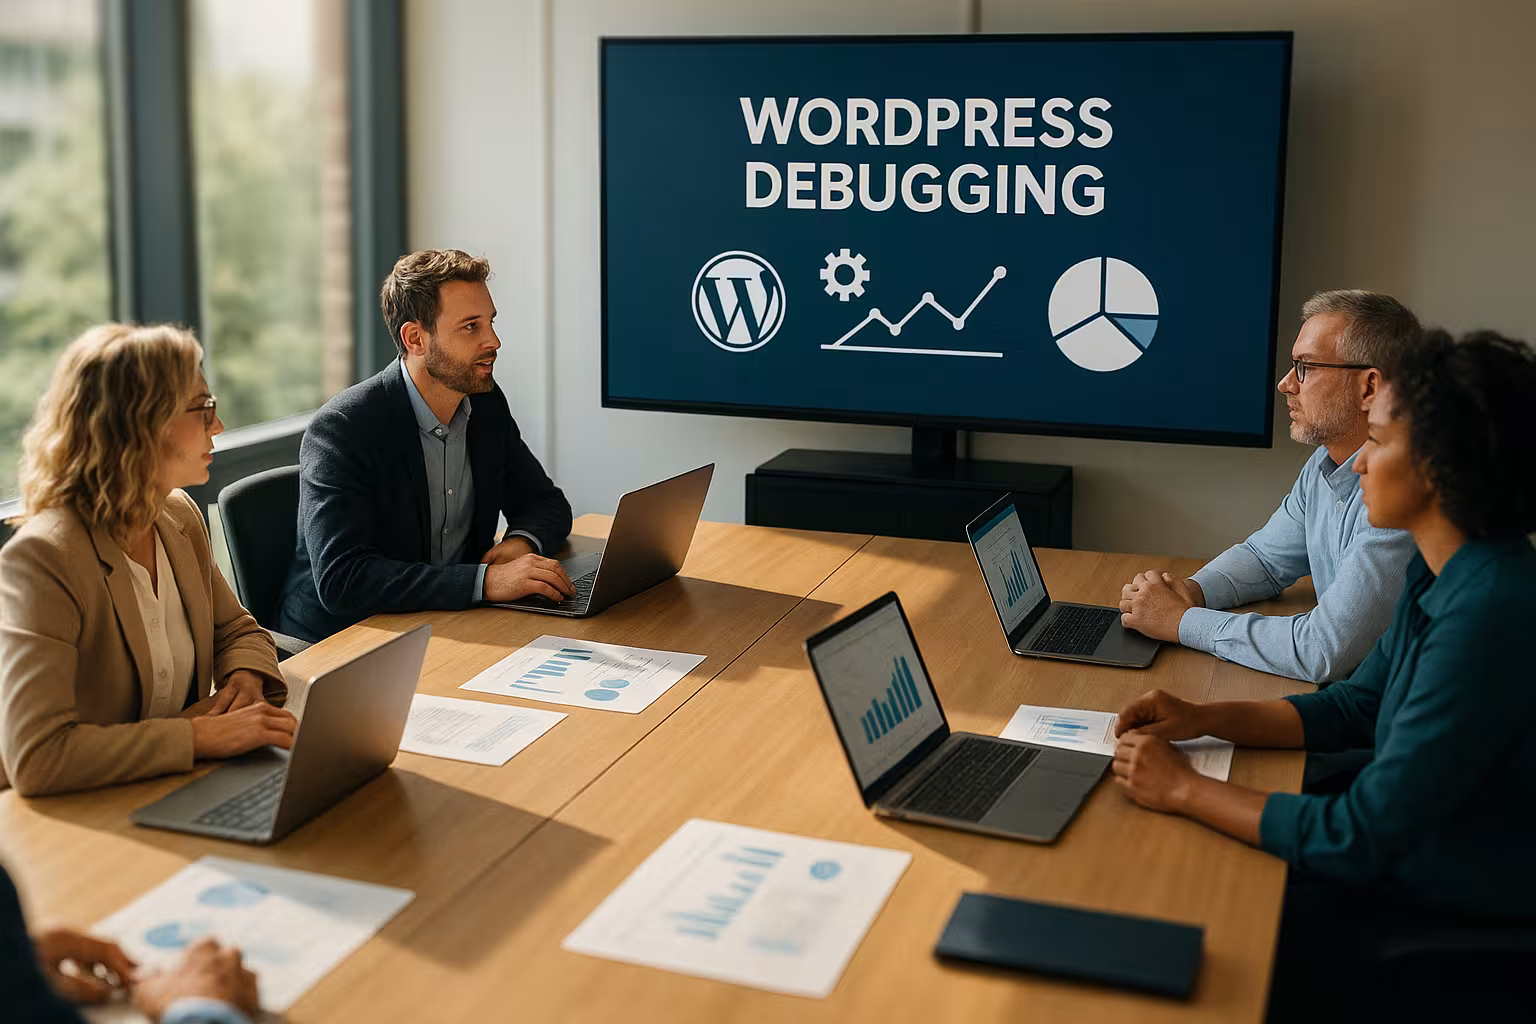
The WordPress Debug Mode enables administrators and developers to quickly identify sources of errors and rectify them in a targeted manner. If you configure and use it correctly, you save a lot of time when troubleshooting and significantly increase the operational reliability of your website.
Key points
- Activation possible via wp-config.php or plugin
- Error logs Evaluate and interpret in a targeted manner
- Debug options how to use WP_DEBUG_LOG & SAVEQUERIES effectively
- Tools such as Query Monitor provide deeper insights
- Hosting plays a decisive role in debugging processes

Many WordPress users only use debug mode when an acute problem occurs. However, the more experience you gain with it, the more worthwhile it is to activate it in the development or test phase in order to rule out potential sources of error in advance. I've seen dozens of times myself how much faster you can implement smooth updates and new features with debug information.
What does WordPress Debug Mode actually do?
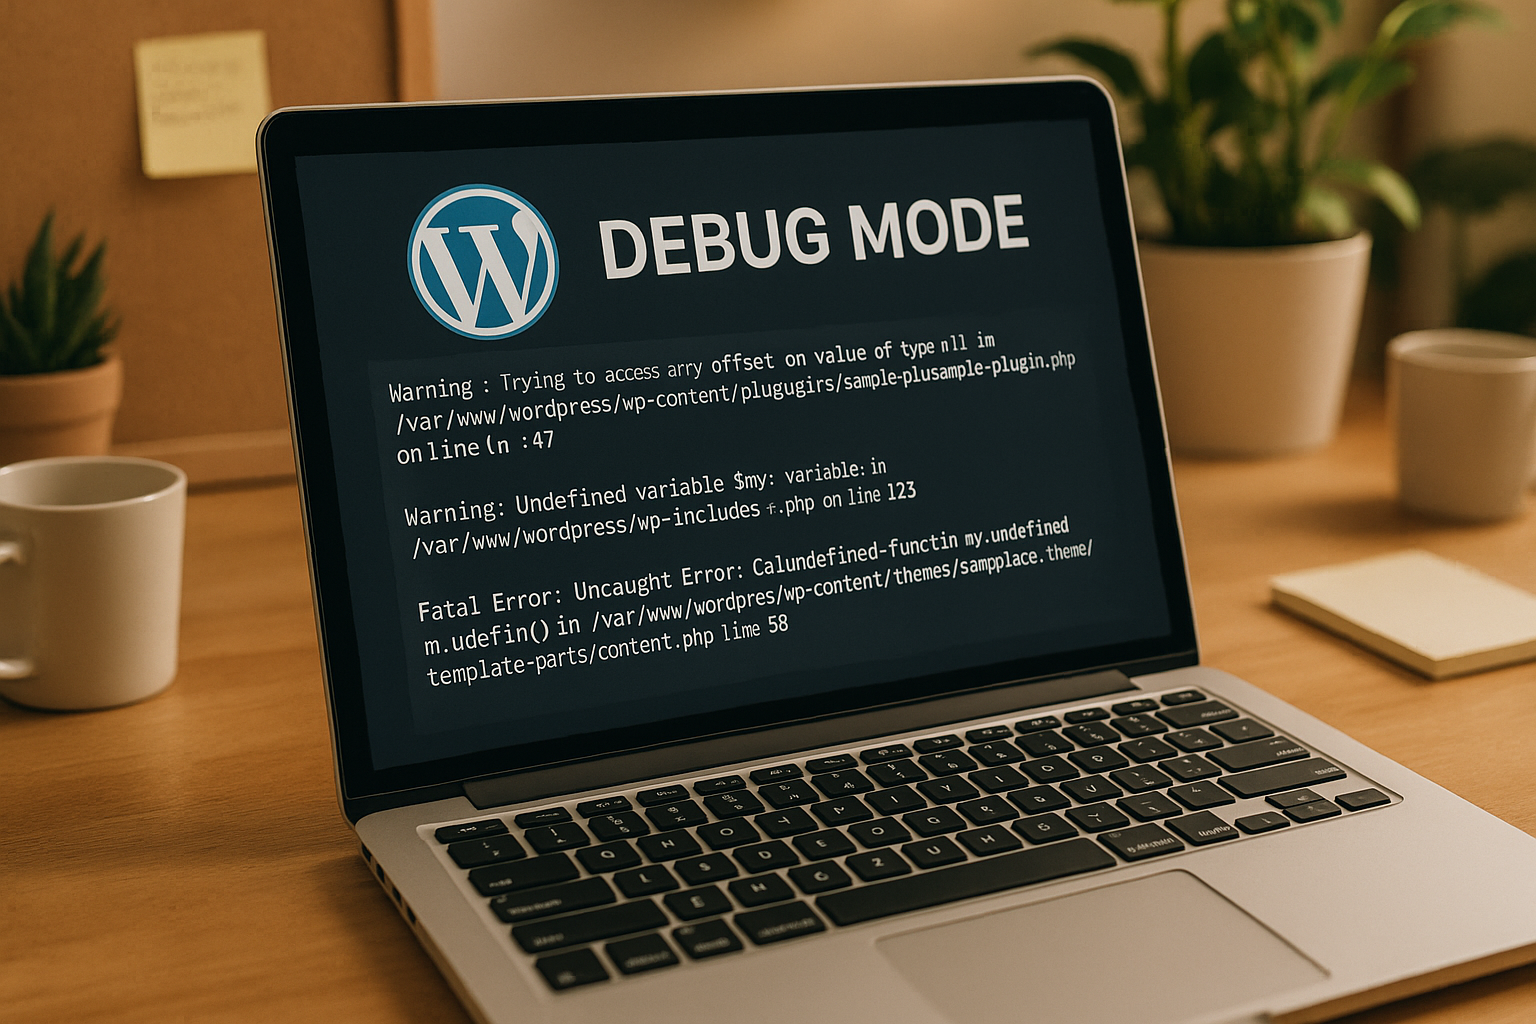
The debug mode displays hidden Sources of error visible. It provides crucial information, especially in the event of inexplicable site behavior or sudden outages. Who WP_DEBUG_LOG activated, all notes in the file wp-content/debug.log can be logged automatically. This is useful if you do not want to display error messages directly but want to document them securely. A targeted evaluation of this file allows you to efficiently trace the causes of performance problems, plug-in conflicts or outdated commands.
Another advantage is the transparency with regard to PHP errors, warnings and minor notices. Because not every malfunction ends with a white screen or a direct error message in the frontend. Sometimes certain bugs are not even noticed before the entire site goes down - due to an update, for example. In such cases, a well-configured debug mode is almost invaluable. I always find it reassuring to know that my wp-config.php is set correctly and that I can access the log files if necessary. This means I hardly miss any hidden error messages.
How to activate WordPress debug mode correctly
The most effective way to activate the mode is directly via the wp-config.php. This method makes you independent of plugins and is particularly flexible. Make sure to activate it before the line "That's all, stop editing!". The combination of deactivating the display in the frontend and writing to the log file also prevents the output of potentially sensitive data to site visitors.
define('WP_DEBUG', true);
define('WP_DEBUG_LOG', true);
define('WP_DEBUG_DISPLAY', false);
@ini_set('display_errors', 0);
Alternatively, a plugin such as WP Debugging ready. It simplifies the process for less tech-savvy users and offers additional functions, for example together with the Query Monitor. It is important for both variants: It is better to back up your database and configuration files before activating the debug function.
Working with plugins is often more intuitive, especially for beginners. At the same time, you can stay up to date with updates without having to manually tinker with wp-config.php. In my experience, trying out the plugin variant in a staging or local development environment has proven to be a good idea. This allows you to safely test whether the debug information is displayed as desired and whether all settings work correctly. Only then would I take these measures in a live environment - and even there only for as long as I really need them. Nothing is more unpleasant than inadvertently leaking sensitive data.
These debug parameters will help you
WordPress recognizes different Debugging optionswhich are important depending on the application situation. You can use wp-config.php to specifically control the scope of error logging. You should be more familiar with some of the options:
| Option | Description | When to use? |
|---|---|---|
WP_DEBUG | Activates the global error message | For development or troubleshooting |
WP_DEBUG_LOG | Logs errors securely in the log file | Recommended for live sites |
WP_DEBUG_DISPLAY | Shows error messages in the frontend | Use locally ONLY |
SCRIPT_DEBUG | Loads non-minimized scripts | For testing new JS or CSS features |
SAVEQUERIES | Logs SQL queries in detail | Performance analysis during development |
The option WP_DEBUG forms the basis: without it, the further parameters do not even take effect. As soon as you tweak performance and compatibility on a local development installation, it is worthwhile SAVEQUERIESto keep an eye on the database queries if required. For me, this is a must, especially when a new plugin causes many additional database accesses. I can then see exactly which queries are causing problems in the log and can react if necessary.
It also makes sense to SCRIPT_DEBUG if CSS or JavaScript problems occur. Minimized or compressed files are good for performance, but make troubleshooting more difficult because they are barely readable. With SCRIPT_DEBUG on the other hand, you use the uncompressed version and can trace every conflict directly. I particularly recommend this to beginners who use glossaries, page builders or complex themes and wonder why Safari reacts slightly differently to Chrome.
Analyze the debug.log file efficiently
After activating WP_DEBUG_LOG, WordPress writes every detected Error message in the debug.log file. You can find the path under wp-content/debug.log. Entries there contain timestamps, sources and message types, among other things. Particularly valuable are references to "Deprecated Functions" or incorrectly passed arguments. If identical error lines appear several times, there is often a plugin or theme problem behind it.
Work in a structured way when analyzing: Note the time window of the error, then check changes to plugins, themes or user-defined code. This will help you narrow down the cause effectively. Especially in the case of frequently recurring warnings, it is worth looking specifically for patterns or correlations with certain visitor actions. I then also look in the server logs or use debug tools to collect any clues.
In some cases, the debug.log file only shows superficial warnings that do not necessarily affect the function. Nevertheless, you should not simply ignore these warnings, as they can be an indication that a theme or plugin part is outdated. These "warnings" and "notices" often provide early information about an imminent change of the PHP version used or a function that will expire in the near future. I have already experienced a plugin using outdated functions for months, which only became a problem when the server was changed.
It is also advisable to introduce a routine for log checks in larger teams. For example, you could take a quick look at the debug.log after every major update and document any anomalies. This reduces the risk of creeping errors that only become apparent when it is actually already too late. This not only creates more stability, but also increases confidence in your own infrastructure.
Troubleshooting: typical scenarios from practice
A functioning debug configuration gives you decisive advantages in the event of specific errors. If a plugin no longer works correctly after an update, the log file usually shows the person responsible immediately. This allows extensions to be specifically identified and deactivated for testing purposes.
In other cases, outdated PHP commands are in use. You can recognize these by warnings about so-called deprecated functions. Either find a more up-to-date version of the extension - or replace it. If error messages also occur with deactivated plugins, the use of a standard theme such as Twenty Twenty-Three helps to isolate errors.
Anyone who has been working with WordPress for some time will also be familiar with the "white screen of death" phenomenon. Suddenly you only see a white page when you call up the site - without any error message. In such cases, I personally find the combination of WP_DEBUG, WP_DEBUG_LOG and WP_DEBUG_DISPLAY (the latter only locally, however). I check the debug.log to see exactly which lines in which files trigger the fatal error. A quick intervention, such as deactivating a plugin or adjusting a theme function, is often enough to get the website up and running again.
Sometimes the cause lies in necessary PHP extensions that are not active or not available. Such compatibility problems creep in, especially when moving to a new server or with smaller web hosting packages. It is worth keeping an eye on both the server error log and the debug.log in order to obtain comprehensive information. I recommend checking the debug mode and the logs directly whenever you change servers - this way you avoid surprises if, for example, an important function such as mbstring or gd is not available.
Professional tools for in-depth debugging
In addition to WordPress' own on-board tools, additional tools support you in error analysis. Query Monitor visualizes database queries, HTTP requests, hooks and PHP errors directly in the backend. You can see at a glance which queries are running too slowly or generating errors. This saves valuable time when analyzing load times.
With Debug Bar you can expand the admin menu to display active hooks, current templates and current logs. If you have direct server access, you can use Xdebug set specific breakpoints and perform a step-by-step evaluation of individual PHP functions.

I have already worked with all of these tools and can confirm that they work together perfectly. Query Monitor is constantly running in my development environment. As soon as I see that a page is taking an unusually long time to load or my SQL queries are coming up empty, I check the recorded queries. Debug Bar, on the other hand, is ideal for quickly keeping an eye on other management functions, such as which hooks are currently active. Xdebug is unbeatable for particularly complex errors where you have to go deeper into the code. I can go through the code line by line and find out exactly where the value flow or variable management is behaving unexpectedly. This is really worth its weight in gold, especially with large and confusing code bases.
Such tools are extremely valuable, especially in a team context. Not only can you debug step by step, you can also share the results with each other. In this way, even less experienced team members quickly learn where an error is hidden and how to recognize it. The learning effect is immense if the tools are used consistently and the logic behind each error message is explained transparently.
Secure debugging correctly: What you need to avoid
Although the debug mode is helpful, it harbors security risks if used improperly. On live pages you should never Error displays in the frontend, as sensitive file paths or internal functions may become publicly visible. Only use the log file and, if necessary, restrict file access on the server side (e.g. via .htaccess).
Also: Debugging log files grow quickly. Delete or move old logs to a protected directory once the analysis is complete. This will prevent unnecessary data volumes and possible security gaps in the future.
In my day-to-day work, I make an effort to check log files regularly and not let them swell up into too much junk data. Especially if you have been managing a project for several years, a lot can otherwise accumulate. People often forget that debug logs could reveal useful information about the project structure in the event of a hacker attack. It is therefore important to handle this data responsibly and not to leave it permanently accessible to the public.
Why good hosting simplifies debugging
A fast, stable server makes debugging and error analysis much easier. Provider with WordPress-optimized Environments not only allow access to logs, but also to file structures, caching settings and error levels. Especially if you manage several websites, it is worth looking at specific hosting offers that meet the requirements of several WordPress projects at the same time.
| Place | Provider | Advantages |
|---|---|---|
| 1 | webhoster.de | SSD hosting, direct support, debug tools pre-installed |
| 2 | Provider B | Fast backups, extended logs |
| 3 | Provider C | Security features, flexible interface |
With easily accessible, responsive support, problems can be identified even faster in case of doubt. Hosts that offer pre-installed debug tools or clear instructions for WP_DEBUG configuration save you tedious research. I myself have developed a preference for hosts that offer performance-optimized server environments and also have a staging system in the package. There you can run debugging in an almost identical environment to the live site without taking any risks.

In addition to this, server-side logs such as the Apache or Nginx error log are of enormous importance. You can sometimes see far more than what WordPress itself logs. A proper problem analysis therefore does not exclude the hosting level. Any caching mechanisms, cron jobs or firewall settings only work properly if their error messages can be viewed if required.
Important tips for everyday life
Take the Error analysis seriously. I document every conspicuous incident in a separate log. This allows me to keep an overview and find solutions to recurring errors more quickly. I also always test new plugins in a staging environment to avoid problems on the live site.
Also keep your WordPress components up to date: outdated extensions often lead to PHP warnings or SQL errors. I update themes, plugins and the core regularly, even if there is no urgent reason to do so. This is because a neglected update often harbors security vulnerabilities and is a frequent cause of conflicts, especially when newer PHP versions are used.
You should also clean up your WordPress installation: remove unused plugins and themes completely instead of just deactivating them. Old, unused extensions often contain outdated code components that could later cause error messages. A lean code inventory makes debugging much easier because you have fewer potential sources of problems.
The PHP version is also crucial. If you are still stuck on an old version, you run the risk of no longer being able to use certain WordPress functions or plugins correctly. Each PHP update not only brings new features, but also removed commands (functions that were marked as "deprecated"). It is therefore advisable to use a test environment to check whether a version change is possible without any problems and whether all themes and plugins are compatible. A debug mode helps to immediately recognize where there are still problems.
Some problems only arise under load, for example when several users access certain pages at the same time or cron jobs overlap. Here it can be useful to not only log sporadically, but also over the long term and to carry out load tests. Especially if you run a highly frequented website or online store, you can effectively identify bottlenecks or deadlocks in the database. I also recommend documenting all changes you make to system parameters (e.g. Memory_Limit) in detail. Breakpoints in Xdebug or debug log entries then show the exact load at which an error occurs.
You should also have a clear division of roles in the team: who tests what, who documents results and who changes code? Good communication helps to ensure that two people do not inadvertently make different debug settings at the same time. I have already seen debug settings being overwritten by each other because nobody knew who had just changed the parameter under stress.
Conclusion: Recognize errors, secure performance
WordPress Debug Mode is one of the most important tools for efficient troubleshooting. If you use it in a targeted manner, you will uncover vulnerabilities more quickly and ensure that your website runs error-free in the long term. Tools such as Query Monitor, secure logs and prompt intervention in the event of warnings are essential.
I recommend activating debug mode only in development environments or for acute troubleshooting. The associated knowledge gain and the structured approach will otherwise save days of work and annoyance - especially in the event of sudden errors. In addition, regular log analyses reduce your risk of security vulnerabilities and optimize performance at the same time. This keeps your website stable and fit for future requirements.