Skip to content
PageSpeed Insights and Lighthouse show similar metrics, but provide different answers to the same pagespeed comparison: PSI combines real user data with lab data, Lighthouse tests under controlled conditions and also evaluates SEO, accessibility and best practices. I'll show you which Metrics What really counts is how you correctly interpret the differences between the two tools and which steps have an immediate effect on ranking and user experience.
Key points
- PSI combines laboratory and field data for real user experiences.
- Lighthouse provides reproducible laboratory values and broad audits.
- Core Vitals (LCP, CLS, INP) decide on SEO and UX.
- Deviations are caused by the device, network, cache and timing.
- Workflow: Build with Lighthouse, check live with PSI.
Why the difference matters: Field data vs. lab data
I always evaluate results according to where the data comes from, because that changes the Statement powerful. PageSpeed Insights provides field data from the Chrome User Experience Report and shows how real people experience your site. Lighthouse measures in a simulated environment with fixed hardware and network throttling, allowing for ideal comparability. Field data uncovers problems that never occur in the lab, such as fluctuating mobile connections, third-party latencies or sporadic layout shifts. Laboratory values, on the other hand, help me to test changes in a targeted manner without external factors distorting the result, and it is precisely this combination that I use for a robust Decision.
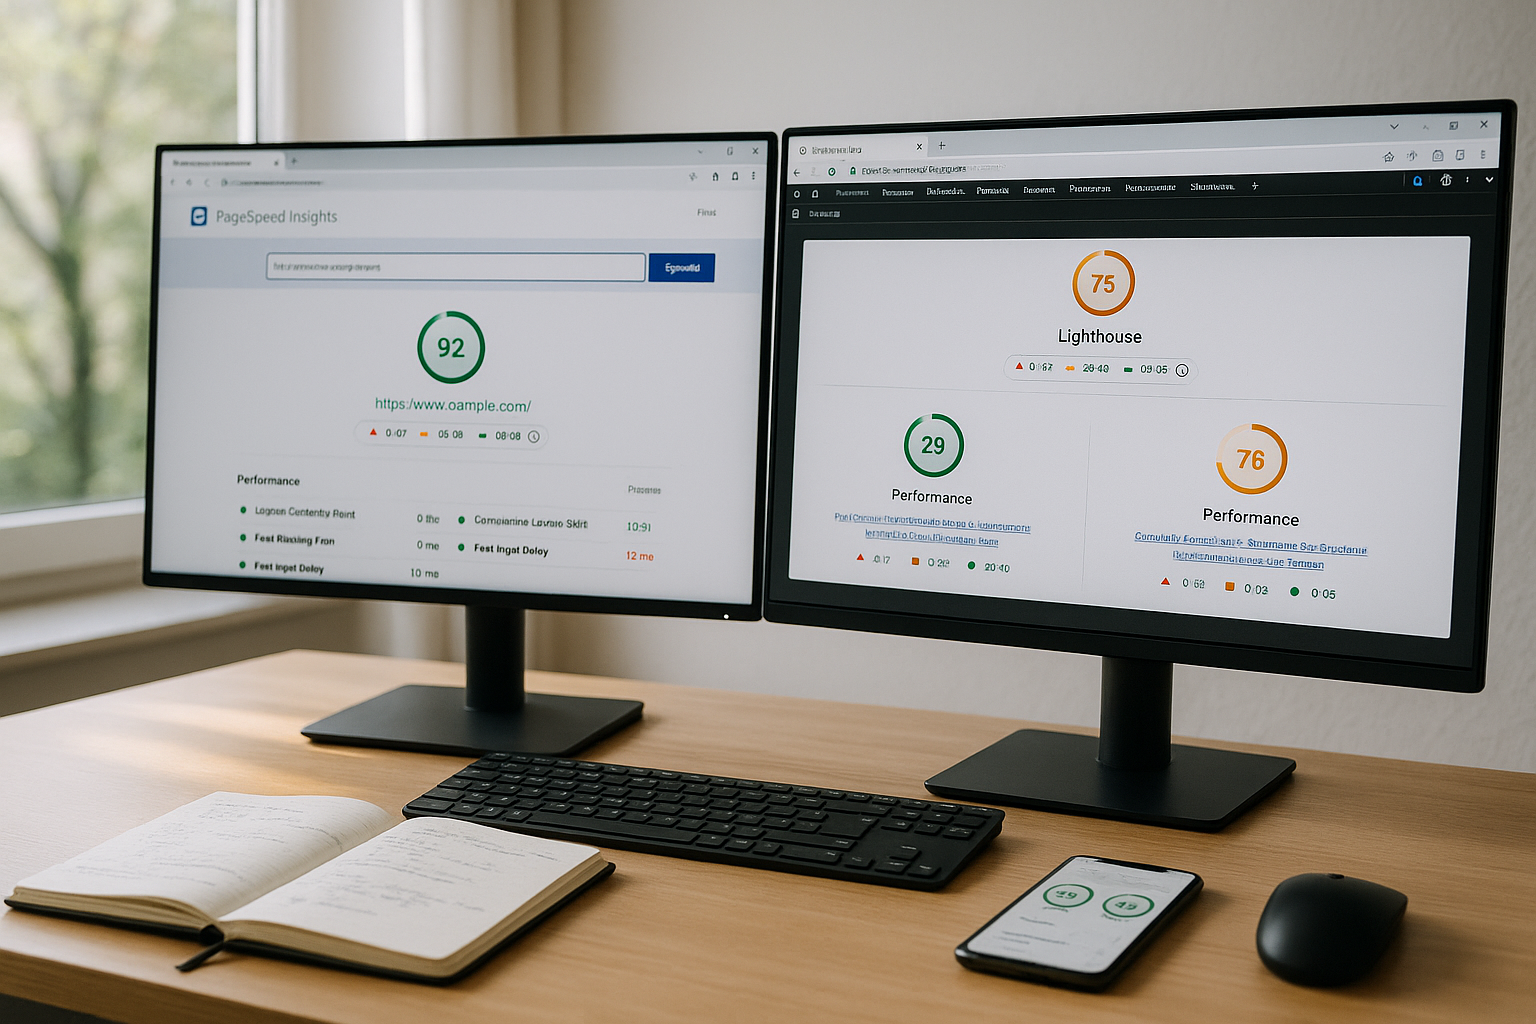
PageSpeed Insights: Functions, metrics, benefits
PSI uses the Lighthouse engine for laboratory data and also displays field data that your Target group generated. The focus is on the Core Web Vitals: Largest Contentful Paint (LCP), Interaction to Next Paint (INP, replaces FID) and Cumulative Layout Shift (CLS). LCP should be less than 2.5 seconds, CLS ideally less than 0.1, and INP shows you the way to responsive interactions. In addition to these core values, PSI shows other key figures such as Speed Index and Total Blocking Time (TBT), which narrow down the causes. Important: The recommendations for action relate to real brakes - such as image sizes, JavaScript blockages or server latency - and therefore directly accelerate your Result.
Lighthouse: Audits with added value for technology and SEO
Lighthouse checks performance, SEO, accessibility, best practices and optionally PWA - a broad Analysis for modern websites. The performance score is calculated from weighted key figures such as FCP, LCP, CLS, TBT and Speed Index, which provides you with a clear prioritization. In addition, the audits uncover accessibility issues that would otherwise be overlooked, such as contrast, semantic structure or focus management. In Best Practices, you will find security and quality checks that reveal risks such as insecure resources or oversized payloads. For me, this makes Lighthouse the ideal tool for testing changes locally, setting up CI/CD gates and gradually reducing technical debt. reduce.
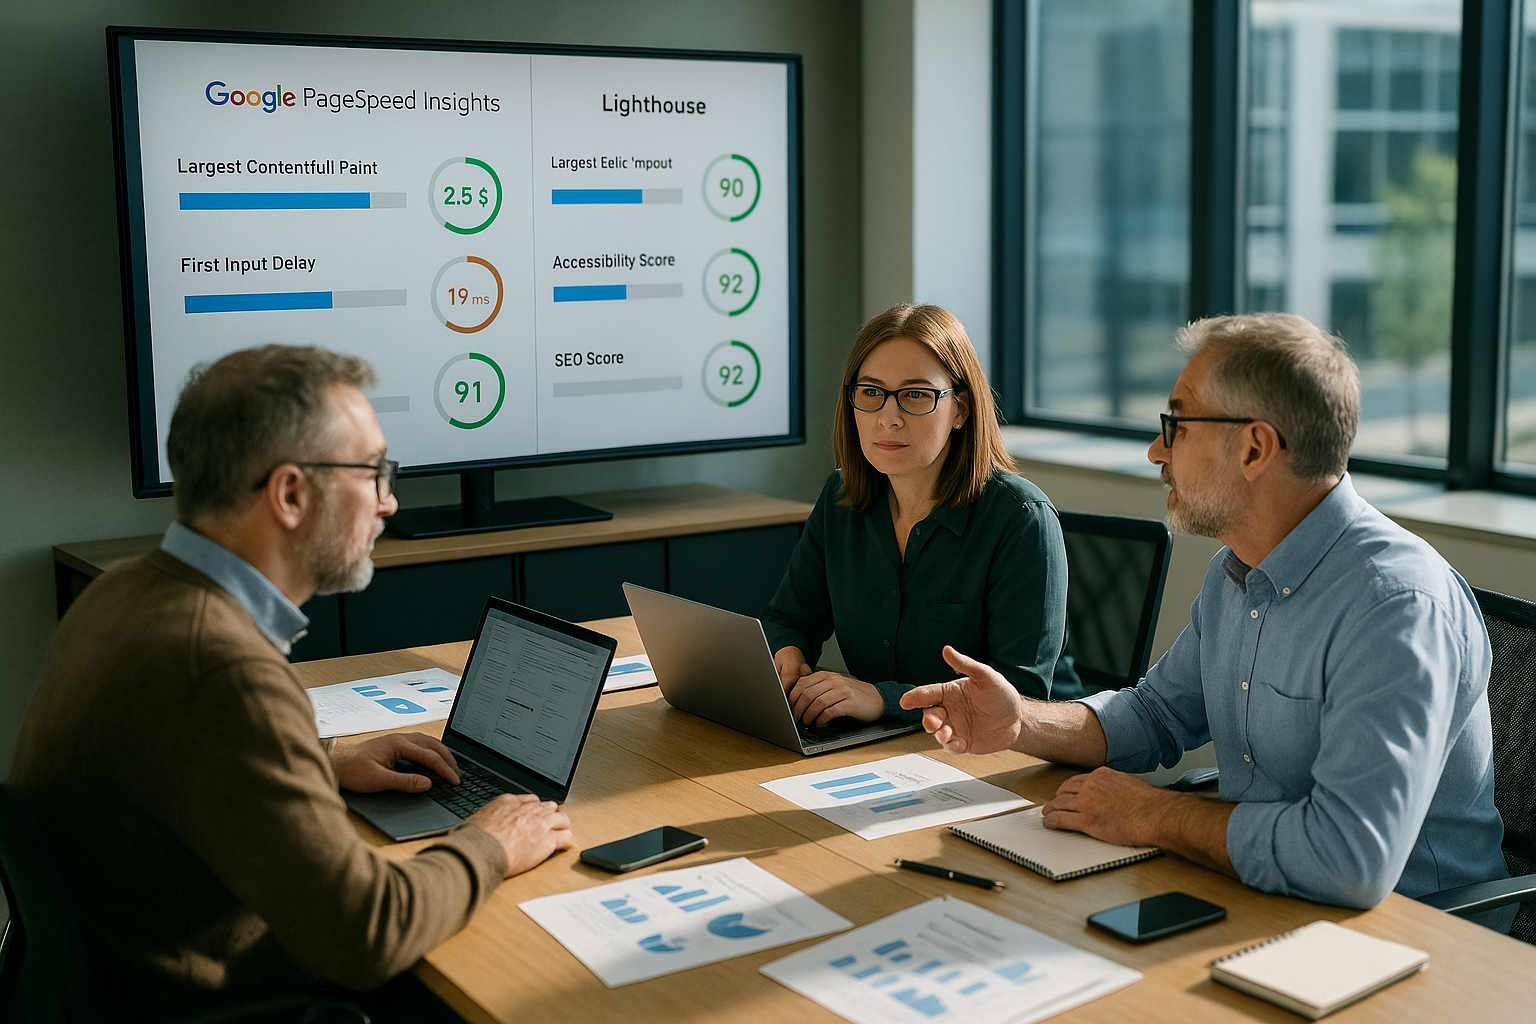
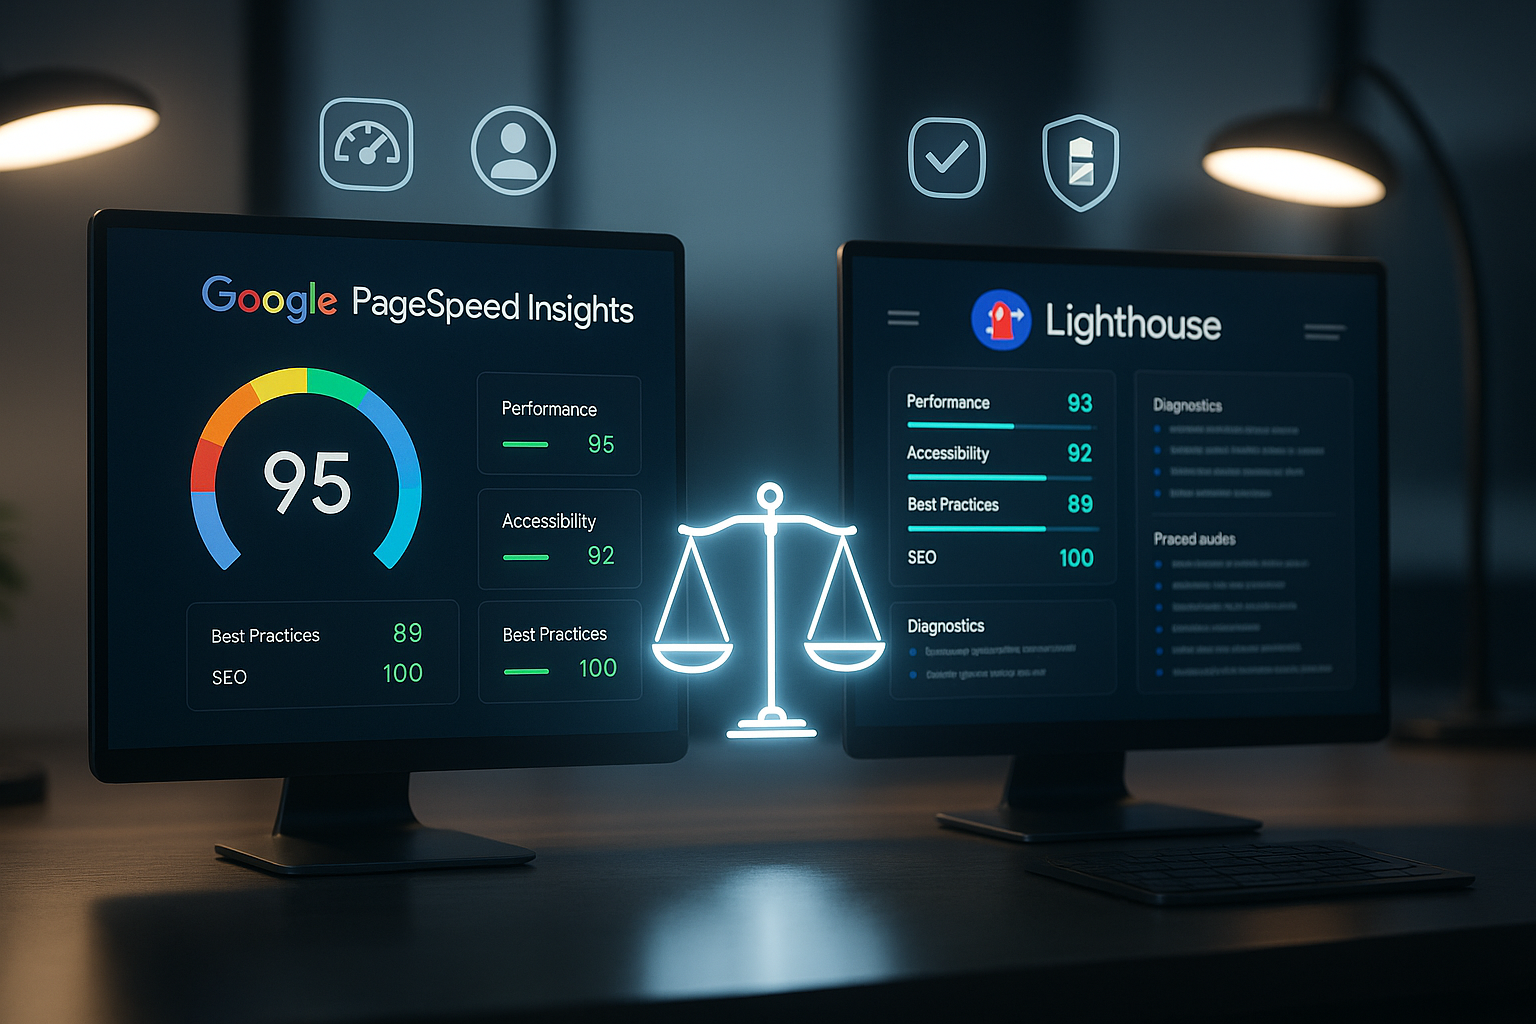
Comparison table: Which key figures help when?
The following overview summarizes the differences and helps with the Tool selection in everyday life. I use PSI for real impact on users and Lighthouse for reproducible diagnoses in the development process. Both perspectives complement each other and cover blind spots. This allows you to make well-founded decisions and recognize which construction sites produce results first. Keep in mind: field data shows live reality, lab values show the pure potential of your Page.
| Criterion | PageSpeed Insights | Lighthouse |
|---|---|---|
| Data basis | Laboratory data + field data (real users) | Laboratory data only (simulated environment) |
| Focus | Performance, Core Web Vitals | Performance, SEO, Accessibility, Best Practices, PWA |
| Use case | For operators, SEO, product managers | For developers, QA, performance teams |
| SEO reference | Direct reference to ranking factors | Comprehensive onpage checks |
| Optimization tips | Focused on real UX problems | Wide range of technical information |
Which metrics are SEO-critical? LCP, CLS, INP explained
LCP, CLS and INP have the greatest potential for ranking and user experience. Weight. LCP measures when the largest visible element is positioned - large images, hero sections or videos often slow things down here. CLS detects layout shifts during loading that cause buttons to move or content to jump. INP measures the reaction time after a click, tap or keystroke and replaces FID as a more reliable interaction signal. If you want to delve deeper, you can find practical tips on Core Web Vitals Optimizationto make visible progress quickly. achieve.
Why values differ: Devices, network, caching
Different scores are normal and have several Causes. PSI field data reflects real devices, different browser versions, mobile networks and regional latencies. Lighthouse, on the other hand, measures with fixed throttling and predefined hardware, which makes results comparable. Caching status, time of day, third-party scripts and A/B tests also shift scores. That's why I check changes in the lab first, roll them out carefully and then compare the live values to get real Effects to confirm.
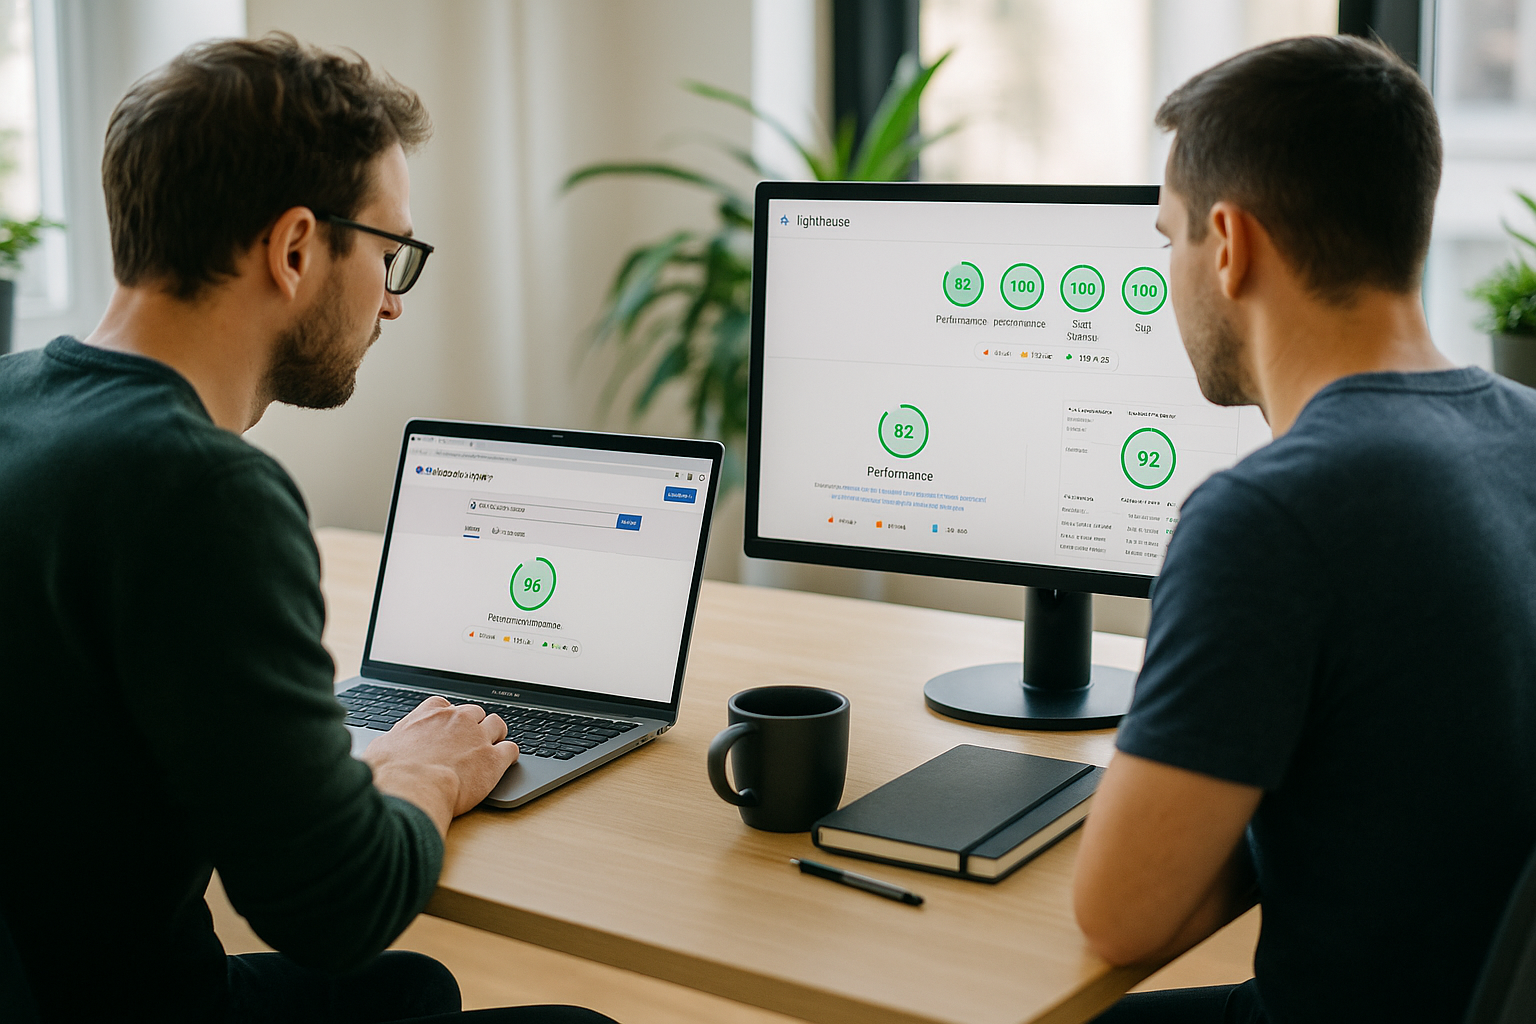
Practical workflow: from local testing to rollout
I start locally with Lighthouse, fix blockers, repeat measurements and save the Quality with budgets. Then I test for staging with realistic images, fonts and third-party scripts. Before the rollout, I check PSI to recognize the effects on real users. After the go-live, I monitor the field data over several days because caches, CDN warmup and traffic mix take time. This process reduces risk and increases the chance of stable improvements for Ranking and turnover.
WordPress and stores: quick profits in 7 days
I often achieve rapid success with WordPress and stores because recurring patterns Performance press. Compress images to WebP, set correct dimensions, deliver critical CSS inline and move non-blocking CSS. Reduce JavaScript, deactivate unused plugins and load third-party scripts only after interaction. Pay attention to fonts: preload for the most important styles, subset for language areas, no oversized collections. You can find specific step-by-step tips in this guide to PageSpeed Insights for WordPressthat points to real bottlenecks aims.
Hosting influence: reduce TTFB, LCP and TBT
Server response time (TTFB) has a direct impact on LCP and TBT, so I check hosting and Caching First of all. Use HTTP/2 or HTTP/3, activate Gzip/Brotli and make sensible use of edge caching. Pay attention to database indices, object cache (Redis) and low plugin load. A fast server reduces render blockages, shortens time-to-first-byte and smoothes interactions. In this way, you can lift the big levers before you have to deal with subtleties such as individual kilobytes in the Bundle work through.
Targeted use of Lighthouse: CI/CD, pull requests, budgets
In development, I use Lighthouse automatically and anchor Budgets in the pipeline. Each pull request triggers a run; if the payload increases or the score decreases, the merge stops. This prevents creeping performance losses due to new libraries, icons or tracking. I also ensure accessibility with repeatable audits so that UX does not suffer under time pressure. If you want to approach this professionally, you can find a compact guide to Lighthouse page analysisthat can be seamlessly integrated into existing workflows. inserts.
Decision support: Which tool and when?
I use Lighthouse for development cycles and PSI for live monitoring. Combination delivers the best image. During the relaunch, I use Lighthouse to identify technical weaknesses such as render blocking, poor LCP sources or faulty preloads. Before the release, I check PSI so that real latency, device landscape and user behavior are taken into account. In day-to-day business, I monitor field data to see seasonal effects and changes caused by third-party providers. This teaches me when to act and when to remain calm, even though individual lab values fluctuate because the real Results fit.
Read PSI correctly: URL vs. Origin, 28 days, 75th percentile
Many misinterpretations arise because PSI field data has its own rules. I pay attention to three points: Firstly, PSI distinguishes between URL-specific Data and Origin data (entire domain). If there is not enough data for a single URL, PSI shows the Origin - this smoothes out outliers, but can also conceal specific page problems. Secondly, the field data is based on a 28-day rolling window; Improvements therefore show up with a time delay. Thirdly, Google rates the 75th percentilenot the average. This means that the site is only considered "good" if 75 percent of the sessions meet the threshold values.
Limit values that I set as a guard rail: LCP less than 2.5 s (good), 2.5-4.0 s (optimizable), above that poor. CLS below 0.1 is considered good, 0.1-0.25 can be optimized. INP should ideally remain below 200 ms, up to 500 ms can be optimized. When I roll out changes, I plan a monitoring window of at least two weeks to ensure that the effects are stable in the 28-day window and are not just short-term artifacts.
Measurement strategy and reproducibility: how to avoid measurement noise
I standardize my measurements so that I can draw reliable conclusions from lab results. I always use the same device or a fixed lighthouse emulation mode, clear the cache, deactivate browser extensions and close all background apps. I make several runs for each change and evaluate Median and Span off. For me, large scattering is a signal to further reduce external influences - for example via stable test servers, controlled networks or the temporary deactivation of A/B tests and chat widgets.
I also measure mobile and desktopbecause mobile throttling hits CPU-heavy pages much harder. For image-heavy pages, I separate warm and cold cache: one run directly after emptying the CDN/browser cache, one run after warmup. I only rate an optimization as robust if both scenarios are good.

Core Web Vitals in practice: precise levers per metric
I prioritize according to impact and effort. For LCP I start with the source of the largest element: this is often a hero image or a large heading. I set responsive image sizes, modern formats and a targeted Preload for the LCP asset. I also assign priorities via fetchpriority and take care not to block the LCP resource with critical CSS or fonts. On the server side, I reduce TTFB via caching and database tuning so that the first byte time does not become a bottleneck.
For CLS I save dimensions: Images and videos receive fixed width/height or aspect-ratioAds and embeds get placeholders. I load web fonts with meaningful font-displayso that FOIT/FOUT does not generate jumps, and I check late DOM manipulations from widgets that move buttons. For INP I eliminate Long Tasks via code splitting, less hydrogenation, delegation of event handlers and offloading in web workers. It is particularly effective to make interactions prepare (e.g. prefetch/preload for routes) instead of only working on click.
Third-party and tracking: control instead of abandonment
Third-party scripts often ruin good lab results. I inventory all Third-Party-resources, measure their share of TBT/INP and define rules: Async/defer where possible, loading after interaction, self-hosting for critical resources (icons, fonts), hard Timeouts for slow endpoints. For advertising and tag managers, I ensure strict triggers and prevent uncontrolled growth. Preconnect to third-party domains that are needed early reduces handshakes; everything else only loads when it is really needed.
I test content banners, chat tools and personalization separately because they often cause late layout jumps or event lags. A clean fallback state (without consent) and "lazy init" after the first user interaction often bring immediate improvements in CLS and INP without jeopardizing business goals.

Single-page apps and frameworks: note the special features
SPAs have other stumbling blocks: The first load is often JS-heavy, after which Soft Navigation and interactions - that's where INP comes in. I rely on server rendering, streaming/partial hydration and Route-based code splittingso that the entire app is not hydrated at once. I optimize critical routes and interactions with selective preloads, while less used areas are consistently "on demand".
For frameworks with server components, I distribute work from the client to the server, reduce hydration and reduce long tasks. Virtualization helps with lists and product tiles so that scrolling and taps remain smooth. I also keep an eye on the interaction hotspots (search, filter, shopping cart) because they are the deciding factor for INP in E2E flows - not just the start page load.
E-commerce specifics: filters, images, personalization
Stores often suffer from many variations of the same problem: too large picturescomplex Filter and aggressive Personalization. I work with image CDNs that resize on-the-fly, set consistent breakpoints and check LCP elements on category and product pages separately. I move filter and sorting logic to web workers or execute it on the server side so that interactions can be felt immediately. I keep personalization asynchronous and ensure that the layout and core content remain stable while downstream content flows in.
For product detail pages I pay attention to Above-the-Fold-Resources: Prioritize hero image, initialize galleries and 360° viewers later, show reviews/recommendations lazily. I test checkout flows separately, because form validation, payment methods and iFrames have their own latencies - response time counts more than raw loading time here.
Prioritizing with impact: from quick wins to roadmaps
I divide measures into three stages. Quick profits (days): Image sizes, fonts, obvious render blockers, preload of the LCP resource. Medium-term (weeks): Code splitting, JS load reduction, refactoring of expensive components, server and caching tuning. Structural (quarter): Architecture change (SSR/ISR), island approach, third-party governance, CI/CD with budgets. This creates a pipeline with continuous progress instead of one-off sprints that lose their effect in the field data.
Deepening budgeting and governance
I anchor performance budgets as red lines: maximum JS payload, number of critical requests, LCP threshold, TBT limit. I set these budgets for each Template type (homepage, category, product, article) because the requirements are different. In the pipeline, budgets block merges if they are breached; in product management, they serve as SLOs against which teams measure their implementation. It is important to start budgets realistically and gradually tighten them with better foundations.
I also define AlertingIf the 75th percentile value for LCP/INP/CLS drifts for three days in a row, I check releases and third-party changes. This prevents creeping deterioration only becoming apparent when rankings and conversion suffer. In this way, performance becomes part of ongoing quality assurance - not just a project goal.
In a nutshell: How to get the most out of it
I use Lighthouse to measure reproducibly and PSI to create real user experiences. confirm. Prioritize LCP, CLS and INP because these values have a noticeable impact on ranking, bounce rate and conversion. Release the big brakes first: server latency, image sizes, render blocking due to CSS/JS and incorrect font loading paths. Establish clear budgets, automated checks and a rollout process with live validation. This creates a reliable cycle of diagnosis, implementation and control - and your project gains both visibility and User satisfaction.