Skip to content
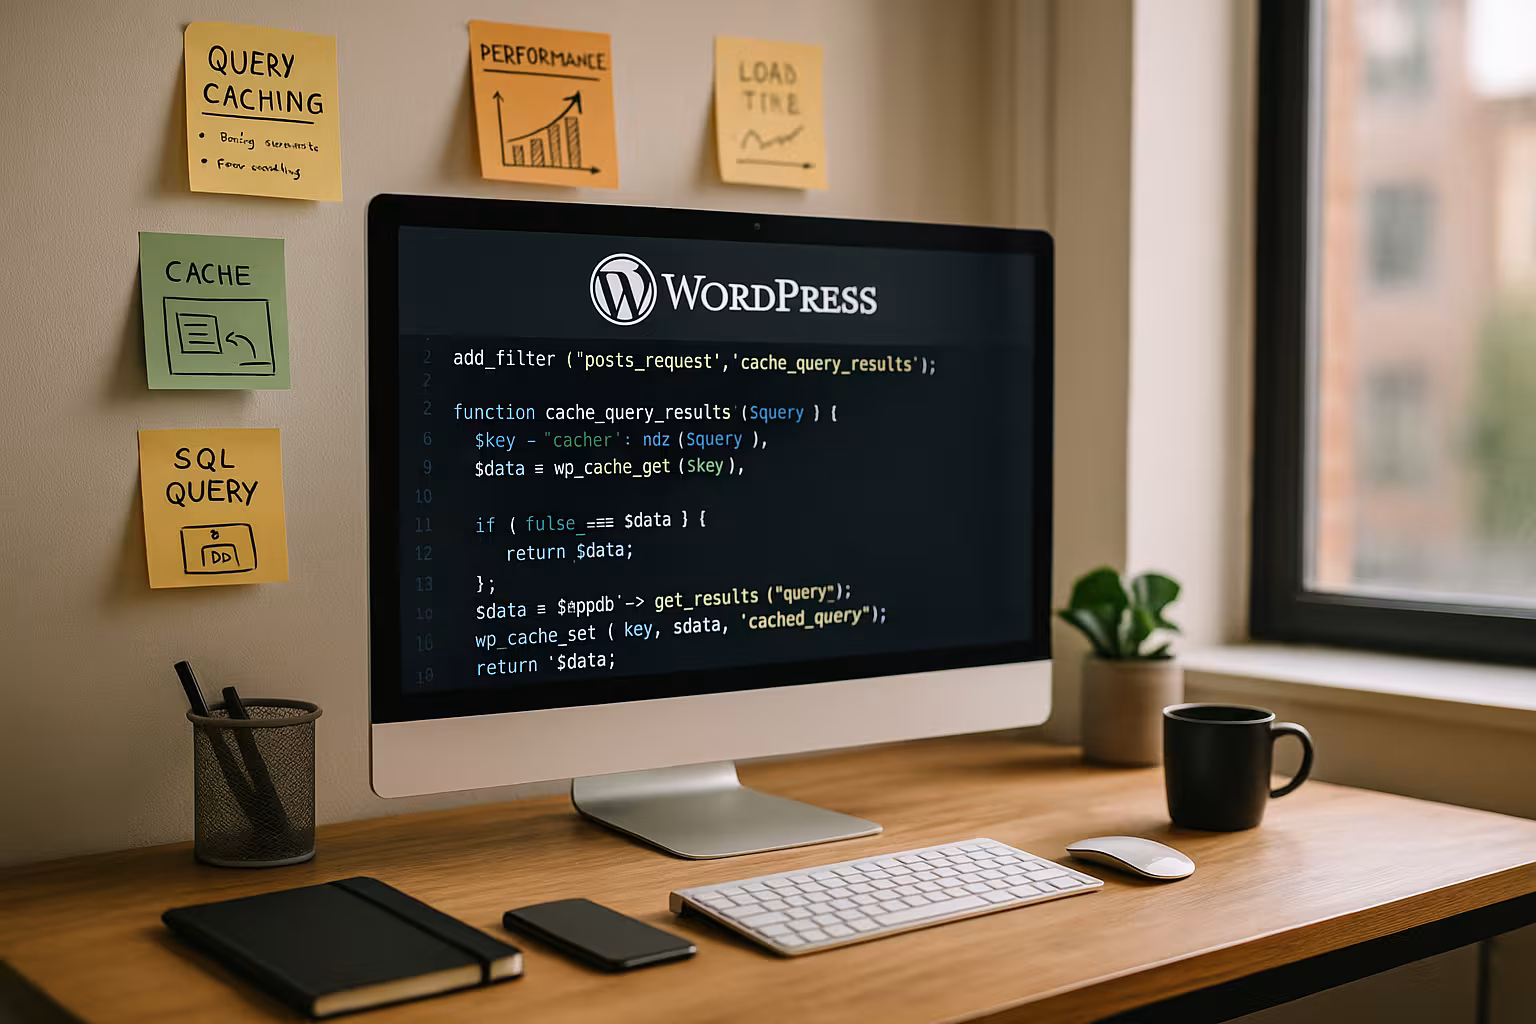
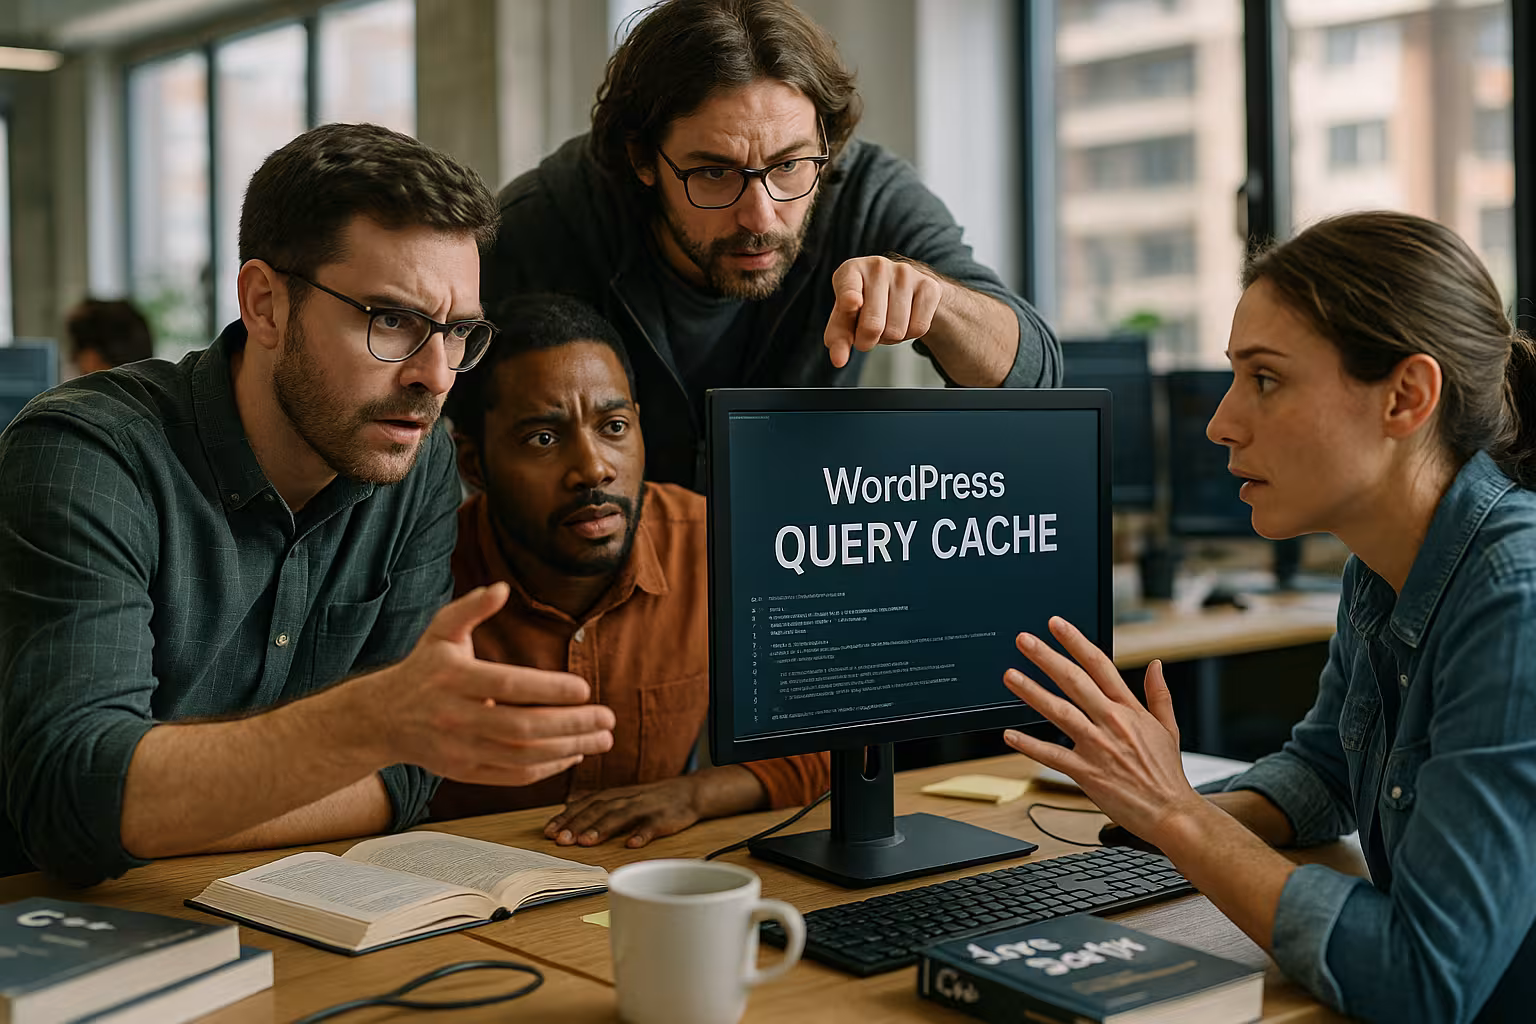
The WordPress Query Cache promises shorter loading times, but in practice often causes invalidations, Latency and inconsistent content. I'll show you why this cache often eats up performance in WordPress setups and how I can achieve stable speed instead.
Key points
- InvalidationFrequent write operations empty the cache and generate overhead.
- LatencyExternal caches add connection time, which often eats up any savings.
- InconsistencyOutdated entries lead to old prices, incorrect lists or empty shopping baskets.
- RAMThe cache competes with PHP, MySQL and Nginx/Apache for memory.
- AlternativesPage caching, OPcache and clean queries deliver the reliable profit.
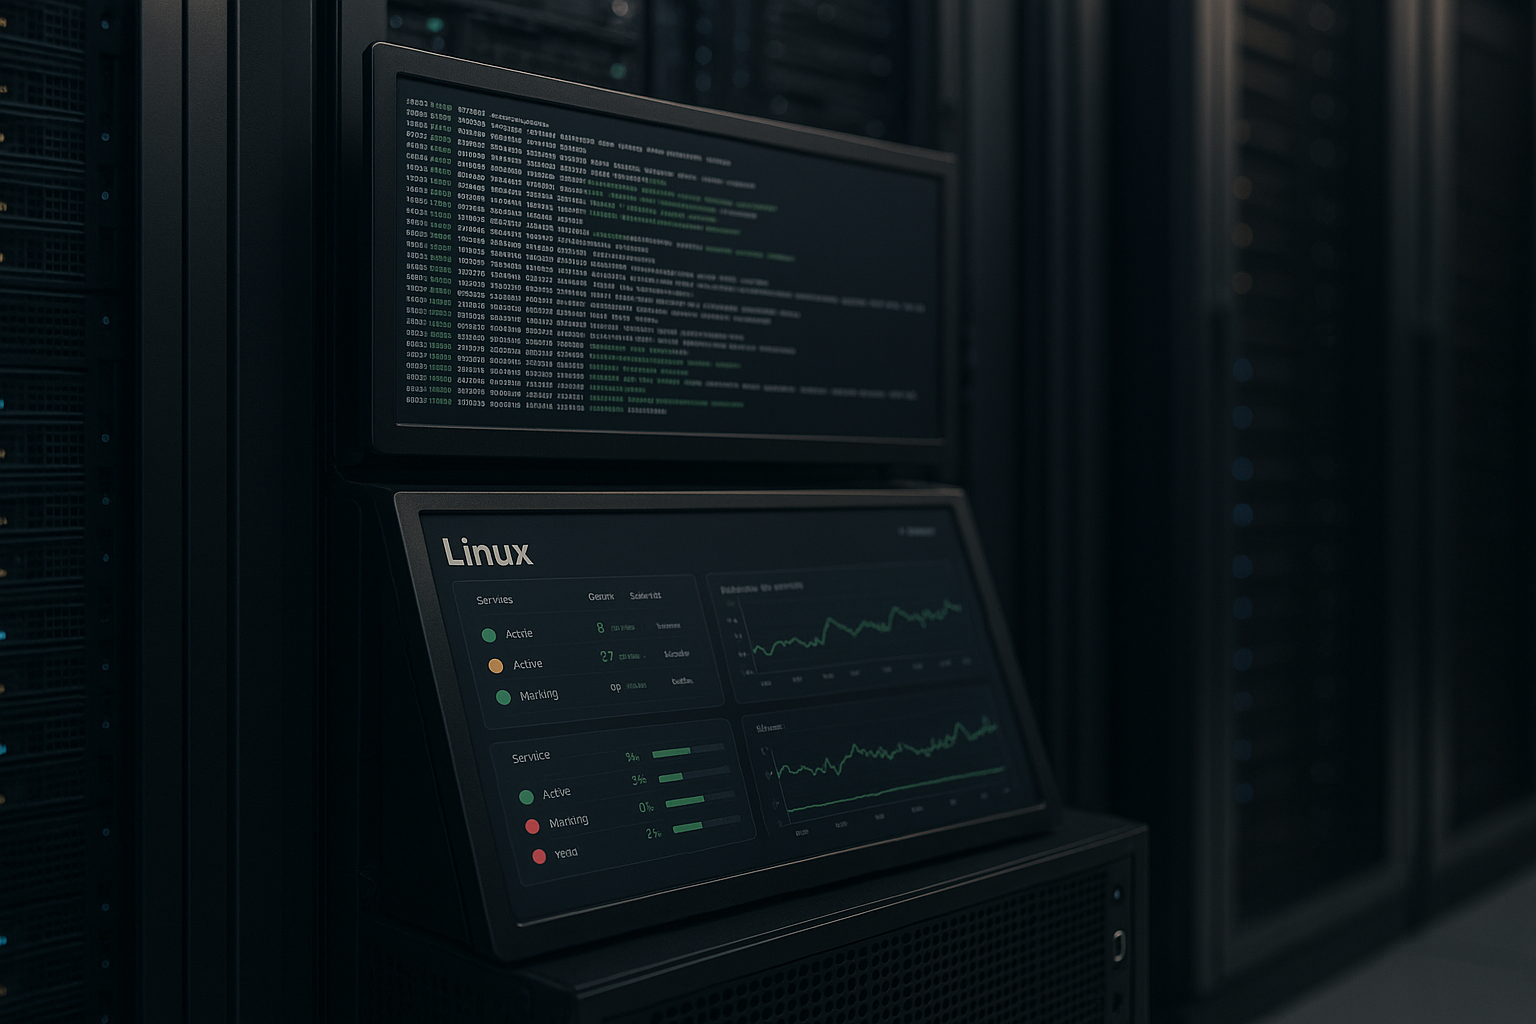
How the WordPress query cache really works
MySQL stores the results of SELECT queries using the exact SQL text in the Cache and delivers it again with an identical query, thus saving execution. In WordPress, however, INSERTs, UPDATEs and DELETEs are received continuously, which immediately loads the query cache for affected tables. disabled. I regularly see an endless loop in logs: fill, empty, fill again - the server burns CPU time without any noticeable benefit. In addition, the MySQL query cache collides with WordPress' own mechanisms such as transients and the object cache, which increases latency instead of reducing it. Anyone who activates the WordPress query cache therefore often builds up a double caching layer that breaks faster than it can support.
Definition: What is really being cached here
I distinguish between three levels, which are often mixed up:
- MySQL Query CacheResult cache for identical SELECT statements. Every write operation to affected tables invalidates entries. This is counterproductive in modern OLTP workloads such as WordPress. In newer MySQL versions, this cache is also obsolete; it still exists in MariaDB, but I switch it off there too.
- InnoDB Buffer Pool: Not a result cache, but a page cache for data and index pages. It is the robust, proven path for recurring read accesses. A solid buffer pool size often yields more than any result cache.
- WordPress object cache/transientsApplication-side cache (often Redis/Memcached), in which prepared structures such as WP_Query results, options or fragment HTML are stored. This layer only helps if read accesses are the rule and invalidation works reliably.
In everyday life, I observe that the buffer pool and a well-chosen page cache are the biggest levers. Additional query caching rarely provides a net gain, but increases complexity, latency and the risk of inconsistencies.
Why it slows down instead of helping
On shared hosts or with WooCommerce, the cache generates noticeable Delay, because every network connection to Redis or Memcached costs time and hardly produces any hits. Even on fast machines, I often lose milliseconds per request, which add up with traffic and inflate time-to-first bytes. There is also the risk of outdated results if invalidation hooks are missing or plugins work incorrectly - suddenly a customer sees an incorrect Price or missed stocks. If you want to take a closer look, I recommend my experience report Object Cache brakes because similar patterns apply to query caching levels. On average, clean direct access to the database with a good schema and OPcache achieves better and more stable response times.

Cache stampede, TTL and coordination
A recurring pattern in WordPress stacks is the cache stampedeOne entry expires, many requests make the same expensive query at the same time and generate spikes. Query and object caches without coordination exacerbate this. I use three strategies to avoid this:
- Locking/Coalescing: One request builds the entry, the others wait briefly or return the old value (stale-while-revalidate) and update in the background.
- Useful TTLsNo arbitrary 24h standards. Product lists or price fragments receive short TTLs (seconds/minutes), catalog metadata longer.
- Event-based invalidationInstead of blunt time sequences, I use hooks (e.g. for post-updates) to delete only affected keys - or better: to specifically renew the page cache.
Important: In WordPress Transients Effective with active persistent object cache permanent saved. If you do not have clean invalidation here, you will create inconsistencies and error patterns that are difficult to reproduce.
Typical symptoms on productive sites
When the WordPress query cache is damaged, I first recognize this by a fluctuating Response time, which suddenly goes up and down without any code changes. In the evening, when more orders come in, invalidations pile up and the site falls into a spiral of cache misses and new entries. The monitoring then shows volatile CPU peaks in MySQL, while PHP-FPM waits for new results. At the same time, customers report mismatches such as duplicate comments, empty shopping baskets or delayed updates of product widgets. Lock warnings are also increasingly appearing in logs because competing processes are constantly writing to the same tables and thus invalidating the cache.
Caching levels: Sequence instead of stacking
I prioritize caches by impact chain:
- Browser/CDN/edge cache for fully public pages, differentiated by cookies/headers.
- Page Cache in the stack (web server/plugin), ideally with preload and targeted purge on events.
- OPcache for consistently compiled PHP bytecode.
- Object cache only selectively for expensive, rarely changing objects.
- Database with strong schema, indices and large buffer pool.
Those who adhere to this sequence not only reduce TTFB, but above all the variance - what users perceive as „jerking“.

Better options for real speed
I reliably gain performance when I first Page caching activate page caching, configure OPcache properly and then streamline database queries. Page caching delivers HTML, reduces database load to zero and smoothes load peaks. OPcache compiles PHP once, which means that PHP-FPM has to do less work and TTFB is reduced. An object-based cache with Redis is only worthwhile if server resources are generously available and the application logic generates few write accesses per page. With this order, I eliminate bottlenecks at the source and keep the number of moving parts manageable, instead of using a fragile cache to maintain.
| Measure | Main benefit | Risk/special feature |
|---|---|---|
| Page caching (static HTML) | Very low TTFB, hardly any DB load | Content must be specifically updated when changes are made |
| OPcache (PHP bytecode) | Less CPU time per Request | Requires consistent deployment and warm-up strategy |
| Redis Object Cache | Quick access to frequent properties | Only helps with hits; eats up RAM, needs a clean key design |
| MySQL Query Cache | Theoretically less query execution | High invalidation effort, inconsistency risk, additional overhead |
Practical guide: deactivate and test alternatives
I start with MySQL and switch off the query cache at system level by changing the configuration to query_cache_type at 0 and query_cache_size at 0 set. Then I clean up WordPress: If a drop-in or a constant forces object caching, I deactivate it as a test with define('WP_CACHE', false);. I then use tools such as Query Monitor, Blackfire or simple metrics (TTFB, queries/requests, CPU) to measure the actual impact per page. Only when page caching is set and PHP/OPcache are running properly do I specifically assess whether a small Redis layer relieves the load on individual hotspots. This sequence gives me reproducible results and ensures Stability, instead of hoping for chance hits.

Concrete configurations that have proven themselves
A few defaults with which I regularly achieve stable gains (always validate on your own system):
- MySQL/MariaDB:
The buffer pool bears the main load. I show the slow log to developers and systematically remove N+1 and SELECT * patterns.[mysqld] query_cache_type=0 query_cache_size=0 innodb_buffer_pool_size=60-70%_vom_RAM innodb_flush_log_at_trx_commit=1 slow_query_log=1 long_query_time=0.2 log_queries_not_using_indexes=1 - OPcache:
A consistent deploy (e.g. atomic symlinks) and a warmup after releases are important.opcache.enable=1 opcache.memory_consumption=256 opcache.interned_strings_buffer=16 opcache.max_accelerated_files=100000 opcache.validate_timestamps=1 opcache.revalidate_freq=60 ; JIT tends to be off for classic WordPress stacks: opcache.jit=0 - PHP-FPM:
This cushions leaks and fragmentation without provoking cold starts.pm=dynamic pm.max_children= pm.max_requests=500-1000 process_idle_timeout=10s - Redis (if used):
I only accept Redis locally or in the same AZ/host - over slow networks it quickly becomes a latency amplifier.maxmemory maxmemory-policy volatile-lru tcp-backlog 511 ; locally preferred via UNIX socket for minimal latency
Keeping the database clean: Indexes, queries, plugins
Before I stack caches, I optimize queries and Indices, because the greatest time saving comes from good data work. Overlong JOINs, SELECT *, missing WHERE conditions and sorting without an index cost more time than any cache can save. I regularly check plugins that store a lot of options in wp_options without an autoload strategy and remove superfluous extensions. A targeted helper can be to sift through and streamline your own SQL patterns - an introduction is provided by Optimize database queries. With clean query discipline, the pressure on the server decreases measurably, and the supposed benefit of the WordPress query cache takes care of itself because there is nothing left to hide.
Hosting factors that beat caching
Good CPU-Performance, fast NVMe SSDs, sufficient RAM and up-to-date MySQL versions make more of a difference than a fragile query cache. The web server configuration also plays a major role: keep-alive, HTTP/2 or HTTP/3, sensible timeouts and a lean PHP process pool. I make sure that OPcache is generously dimensioned so that the bytecode of the frequent scripts fits in completely. At the same time, I limit cron jobs and background tasks that trigger query storms during peak times. This creates a solid base performance on which I can use page caching and targeted object caching with pinpoint accuracy without getting bogged down in brittle Workarounds to lose.

Measurement methods: How I assess the effect
I first measure the Baseline without query cache: cold start, warm start, then 50 to 200 requests with JMeter or k6. I then activate just one adjustment screw, never several at the same time, and repeat the load tests. I record metrics such as TTFB, P95/P99 latency, queries per request, cache hit rates and CPU/IO values. For me, a real win is when the median and P95 fall, error rates drop and the variance becomes smaller. In pretty much all WordPress projects, this method shows that the WordPress Query Cache increases the variance and reduces the mean Response value deteriorated.
Tuning playbook: Thresholds and checks
- Hit rateUnder ~60% object cache hits on productive traffic it is rarely worth it. I then consistently deactivate and measure again.
- Redis latency>1 ms median local is too much. Sub-millis can be achieved via UNIX socket and short pipeline.
- DB waiting timesRises Threads_running under load, I first check indices/queries - do not turn up the cache.
- varianceA falling P95 is more important to me than a cosmetically better median statistic.
- Invalidations: With every content or price update, I observe how many keys are dropped. Broad deletions are an anti-pattern.
- Warmup: After deploys/page purges, I prewarm critical routes (start page, category, checkout) automatically.
Compatibility and risks with plugins
Some extensions overwrite cache keys, clear transients too early or ignore necessary Hooks, which leads to orphaned entries. In multisite environments, problems become more visible because more write events occur in parallel and invalidation occurs more frequently. E-commerce workflows with dynamic prices, vouchers and shopping cart fragments are particularly sensitive: even a few milliseconds delay can topple checkout metrics. I therefore isolate caching problems by gradually deactivating plugins and verifying them at clear measuring points. If an add-on requires the query cache, I do without it and choose a solution that works without vulnerable Intermediate layer works cleanly.
Operational security: rollback and maintenance
I keep caching changes rollbackable. This means: feature flags for object/page cache, separate configuration files and a checklist for emergencies. If something goes wrong under load, I first pull the query/object cache and let the page cache + OPcache work. After that:
- Flush targeted instead of globally: Only delete affected keys, do not empty the entire Redis.
- Use WP-CLI:
Save metrics beforehand, then measure again.wp cache flush wp transient delete --all - Rotate logs and slow query log instead of turning the cache slider.
Brief summary: What I hire and why
I turn off the WordPress query cache because invalidation, Latency and inconsistency eat up the theoretical profit. Instead, I rely on page caching, OPcache and clean database work that delivers consistently and without surprises. I use Redis selectively if there is a clear hotspot and enough RAM is available. Anyone who measures objectively will quickly recognize: well-structured queries, strong host resources and HTML caching provide the calm, fast responses that every site needs. This keeps performance predictable, saves server costs in euros and avoids error patterns that cannot be reliably intercepted with any query cache.