Skip to content
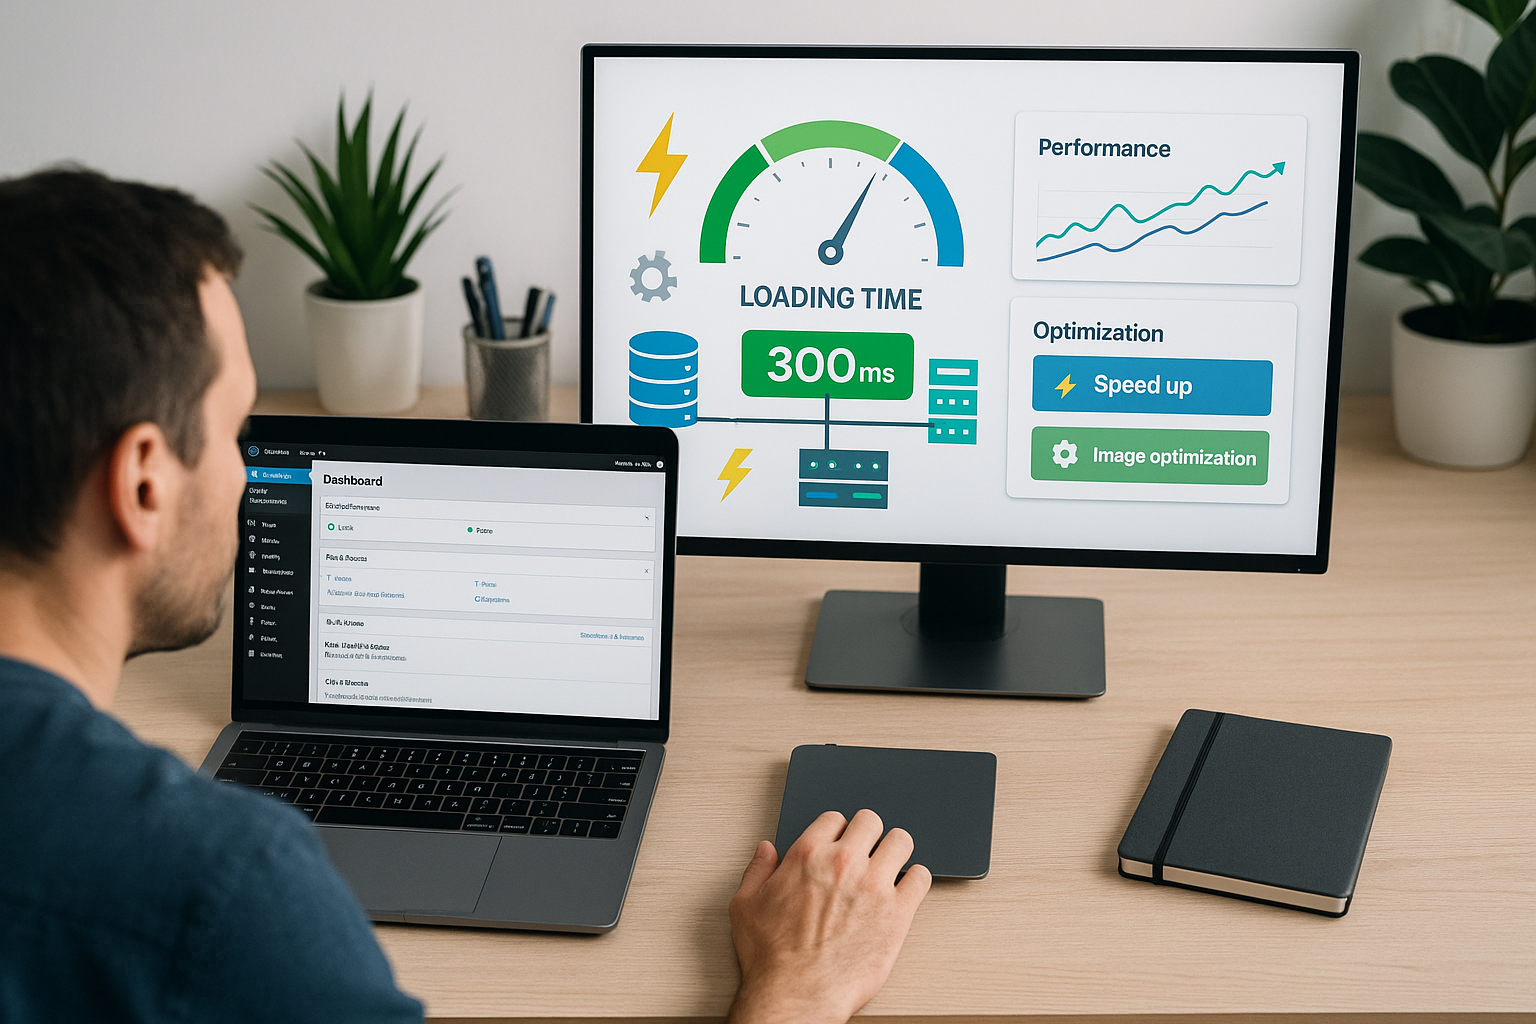
Core Web Vitals Monitoring Hosting is successful when I combine setup, data sources, and alerts cleanly. In this guide, I show specific steps with tools., RUM, CrUX, dashboards, and hosting tuning—including examples, thresholds, and decision-making criteria.
Key points
- Metrics Understanding: Correctly interpreting and prioritizing LCP, INP, and CLS.
- RUM Introduce: Compare real user data with lab tests.
- Alerts Set: thresholds, escalation, and clear ownership.
- Hosting Optimize: server, CDN, caching, and database setup.
- Dashboards Build: Identify trends, derive measures, secure results.

Core Web Vitals in hosting: Interpreting key figures correctly
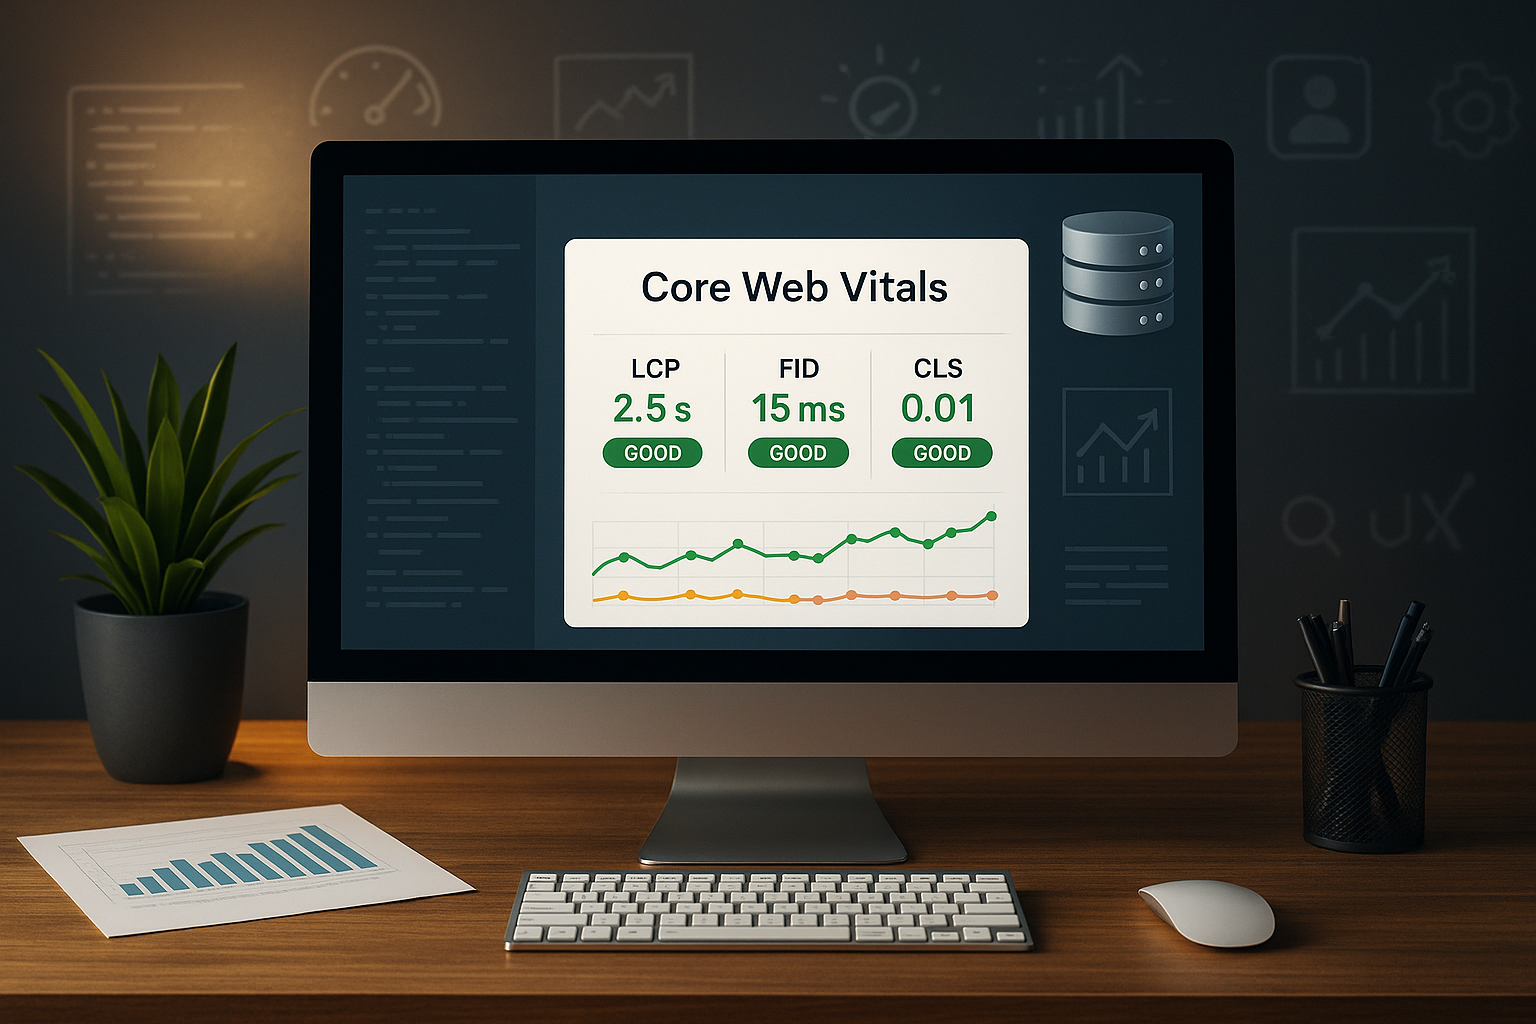
I prioritize the three key figures first. LCP (Largest Contentful Paint), INP (Interaction to Next Paint), and CLS (Cumulative Layout Shift). LCP shows how quickly the most important content block becomes visible, INP measures the response time to user input, and CLS describes the visual stability of layouts. For a good user experience, I aim for LCP around 2.5 seconds, INP in the low hundred millisecond range, and CLS below 0.1. I always look at these values together because optimizations often have side effects, such as when I reduce render blocking and interactions become possible earlier. Without clean Hosting High latencies distort the measured values and make prioritization difficult.
Measurement strategy: p75, segments, and budgets
In my dashboards, I work with the 75th percentile (p75), separated by mobile and desktop – this is exactly how Google Search evaluates performance. I also segment by country, connection type, and device to reveal the real causes. For teams, I define performance budgets per page type (e.g., home page, category page, checkout) and per release. These budgets are measurable (p75-LCP ≤ 2.5 s, p75-INP ≤ 200 ms, p75-CLS ≤ 0.1) and are reflected in the CI/CD process: Builds that exceed budgets generate warnings or are blocked until countermeasures are documented.
Manual checks: quick analyses with free tools
To start with, I perform selective tests using PageSpeed Insights, GTmetrix, and WebPageTest and compare the results. This allows me to detect render-blocking, oversized images, third-party slowdowns, and inappropriate caching headers. For interpretation, I use short benchmarks and check differences between mobile and desktop. Those who are familiar with the methodological differences are better able to read the results—a quick overview helps here, for example, with PageSpeed vs. Lighthouse. These checks provide clear starting points; however, I rely on continuous data and reliable Alerts.
Setting up synthetic tests correctly
I plan synthetic measurements such as regression tests: fixed test devices, defined bandwidth (e.g., 150 ms RTT, 1.6 Mbps down for mobile), identical location, reproducible cookies. I measure both „cold“ (without cache) and „warm“ (with cache) to evaluate CDN and browser cache separately. I run critical flows (login, search, checkout) as click paths with timings and screenshots. It is important to have a baseline: a stable reference run per day serves as an anchor so that fluctuations are noticeable and not confused with noise.

Chrome DevTools and Web Vitals in everyday life
In my daily development work, I open the Chrome DevTools performance panel and record interactions. This allows me to identify long tasks, layout invalidations, render blocking, and hotspots in third-party scripts. The Web Vitals Extension gives me direct feedback in the browser and shows how changes affect LCP, INP, and CLS. This allows me to evaluate code refactorings immediately, without waiting for the next release. A disciplined approach gives me fast learning cycles and saves me expensive demolitions.
Frontend patterns that noticeably improve Web Vitals
- LCPPrioritize LCP elements early (preload for images/fonts,
fetchpriority="high"in the LCP image), critical CSS inline, non-critical CSS viamediaorrel="preload" as="style" onloadload. Always width/height oraspect-ratiosit. - INPSplit long tasks into microtasks (
await Promise.resolve()), Utilize idle phases (requestIdleCallback), keep event handlers lean, debounce/throttle, avoid unnecessary re-layouts. Load third-party scripts lazily or with consent. - CLSReserve placeholders, fonts with
font-display: swapand stable metrics, integrate dynamic components with fixed container sizes, render ads/widgets with stable slots. - Resource references:
preconnectto the CDN/origin,dns-prefetchfor third-party domains, targetedpreloadfor key fonts, hero images, important scripts.
Monitoring platforms at a glance: functions, data, and use
For continuous monitoring, I rely on specialized services that combine field and lab data, measure global locations, and send notifications. Flexible thresholds, segmentation by device, network, and country, and data retention for trends are important to me. I select tools based on whether they reflect real usage profiles or provide more synthetic control. Depending on the size of the project, I combine both and link business KPIs. The following table summarizes the key strengths of common solutions and helps with a quick pre-selection.
| Platform | measurement data | Alerts | Special features | Typical use |
|---|---|---|---|---|
| Super Monitoring | Lab + Field | Email, integrations | Schedules, Mobile/Desktop Switching | Regular audits and threshold monitoring |
| DebugBear | Lab (Lighthouse) + CrUX | Notifications | Current Lighthouse analyses without waiting window | Fast page drilldowns, regression control |
| CoreDash | RUM + CrUX | Configurable | Long data retention, domain-wide coverage | Long-term trends of real users |
| ThousandEyes | Synthetic measurement points globally | Fine-grained thresholds | Location-based analyses from ~200 cities | Geographic latency and routing issues |
| Coralogix | RUM + Logs + Metrics | Correlated alerts | Full-stack correlation all the way to the backend | Root cause analysis beyond the front end |
Dashboards, SLOs, and deployment transparency
I build dashboards along the funnel (entry, product, checkout) and display p75-LCP/INP/CLS alongside TTFB, error rate, and abandonment rates. I annotate important releases so that jumps can be explained. From this, I derive SLOs (e.g., ≥ 85% good LCPs on mobile) and monitor burn rates: How quickly is the fulfillment rate falling? If it is exceeded, the team implements countermeasures (feature rollback, asset rollup, CDN rule).
RUM in real time: Setup with web-vitals
I install the official web vitals-Library small and targeted to capture measurement points directly in the user's browser. I send the data to my own endpoint or to a RUM service that groups sessions, forms buckets, and shows trends. This gives me real field data across device classes, connections, and countries. I first check the basics: correct sampling rate, GDPR-compliant anonymization, and clean event names. With these building blocks, I make decisions based on real usage and not just synthetic data. Tests.
RUM implementation: compact code example
I use attribution to identify causes (e.g., which element was LCP):
import { onLCP, onINP, onCLS } from 'web-vitals/attribution'; function send(metric) { const body = JSON.stringify({ name: metric.name, id: metric.id, value: metric.value, rating: metric.rating, // 'good' | 'needs-improvement' | 'poor'
    delta: metric.delta, navigationType: metric.navigationType, attribution: metric.attribution // e.g. element, url, loadState, target }); if (navigator.sendBeacon) { navigator.sendBeacon('/rum', body);
  } else { fetch('/rum', { method: 'POST', body, keepalive: true, headers: { 'content-type': 'application/json' } }); } } onLCP(send); onINP(send); onCLS(send);
I use moderate sampling (e.g., 5–10%), additionally log build hash, page type, and A/B variant as dimensions, and mask personal data. For SPAs, I also send measurements when navigating within the app (monitor route changes).
Using CrUX effectively
CrUX provides me with free, aggregated values as a reference for my domain. I use this to read the distribution of LCP, INP, and CLS and see how my site is performing over the course of a month. For releases, I compare the development and check whether optimizations are having an impact in everyday use. CrUX does not replace RUM at the project level, but it offers a good external view and helps with benchmarks. With this information, I set realistic Goals for further work.

SPAs and routing: Special features when measuring
With single-page apps, additional LCP/CLS events occur after the initial load. I trigger measurements when routes change (History API) and mark interaction groups for INP (e.g., typahead, filter change). It is important to design UI transitions with skeletons and reserved placeholders to avoid CLS. For monitoring, I separate initial load and in-app navigation into two panels so that effects are not mixed.
Hosting setup: server, CDN, and caching
For fast responses, I minimize TTFB through strong Server, edge caching, and clean database configuration. A CDN lowers latency, reduces packet loss, and takes the load off the origin. I activate HTTP/2 or HTTP/3, use Brotli compression, and deliver images in WebP/AVIF. Critical CSS blocks inline, remaining assets asynchronous—that's how I achieve good LCP values. For INP, I keep the main thread free, reduce third-party scripts, and split long tasks with Scheduling.
CDN and cache patterns in detail
- Cache controlFor static assets, I set long TTLs (e.g., 1 year) with hash names; for HTML, I use shorter TTLs plus
stale-while-revalidateandstale-if-error, to cushion losses. - edge strategiesTargeted edge caching via cookie/header stripping, device-based variants, early hints (103) for preloads.
- picturesOn-the-fly resizing at the CDN, automatic format selection,
srcset/sizesandloading="lazy"for offscreen media. - Server timing: I set
Server timing-Header (e.g.app; key=120,db;major=35) to assign backend shares to the LCP.
Server tuning: from PHP-FPM to Node
- PHP-FPM: Suitable
pm.max_children, activate OpCache, check slow logs, use persistent object cache (e.g., Redis). - Node: Process cluster matching the CPU, asynchronous IO, no blocking JSON operations in the hot path, Gzip/Brotli via reverse proxy.
- DatabaseCheck indexes for frequent queries, connection pooling, read replicas for peaks, and query plan regressions after deployments.
- Cues: Decouple heavy tasks (thumbnails, exports) to avoid burdening TTFB.
Practical implementation setup
I start with an audit, define target values, assign responsibilities, and set up a dashboard. Then I combine RUM, global synthetic monitoring, and DevTools workflows in the sprint process. I have a checklist ready for implementation logic: remove render-blocking elements, check caching headers, reduce payloads, prioritize third parties. If you want to dive deeper, you can find concise instructions at Optimize Web Vitals. Finally, I document all assumptions so that I can accurately assess the effects after release. valued.
Playbooks for root cause analysis
- LCP spikeCheck CDN status, origin CPU, image sizes/transformation time, preload losses, HTML TTFB. If necessary, temporarily simplify the hero image.
- INP recourseSearch for long tasks > 200 ms, new event handlers, main thread blockers (polyfills, analytics). Separate rendering and logic.
- CLS increaseCheck for missing size specifications, font changes, late injects (A/B, ads). Fix reserve areas and font metrics.
Alerts and response management
I set thresholds for LCP, INP, and CLS per device and country so that real problems stand out. I forward alerts to the right people and add a clear escalation chain. Each message contains a brief playbook note: hypotheses, checks, and initial fixes. For recurring patterns, I define auto-tickets and priorities based on impact and frequency. With this approach, I can act quickly, avoid blind spots, and ensure Ranking-Potential.
- Sample rules: p75-LCP (mobile) > 2.5 s for 3 hours → Sev2, p75-INP > 200 ms for 1 hour → Sev2, p75-CLS > 0.1 for 6 hours → Sev3.
- Sensitivity: Additionally, consider relative deltas (e.g., +20% week-over-week) and traffic weighting.
- OwnershipEach rule belongs to an owner (team/person), including on-call windows and escalation.

WordPress: Tuning for better Web Vitals
With WordPress, I remove unnecessary plugins, load scripts as needed, and use server-side caching. I minimize CSS/JS, set delays for third-party widgets, and keep an eye on critical CSS paths. I optimize image sizes automatically, and lazy loading remains active for offscreen media. For specific suggestions, I use the compact guide to Speed up WordPress. This allows me to significantly reduce LCP and INP, keep the layout stable, and save valuable Resources.
- On the server side: Current PHP version, OPcache, persistent object cache, page cache at the edge, reduce heartbeat frequency.
- Themes/Plugins: Extract critical styles, disable unused widgets, load jQuery only when necessary; inline CSS for above-the-fold content.
- MediaResponsive images with correct
srcset/sizes, Prefer AVIF/WebP, fix dimensions in the markup. - writings:
preloadfor main font, subset fonts,font-display: swap, stable line heights to avoid CLS.

Data protection and governance
I only collect the data I need to improve: no clear data, no sensitive content, IPs masked, sessions pseudonymized. RUM runs without cookies, sampling is clearly documented. Access to dashboards is role-based, and there are clear retention periods. This ensures that monitoring remains effective and compliant.
Conclusion & next steps
To summarize: Start with selective checks, enable RUM, supplement with global synthetic measurements, and define reliable Alerts. Set up your hosting for short distances, use a CDN, and keep payloads small. Create a dashboard that visualizes trends and link it to ticketing. Schedule regular reviews after releases and check the impact on sales, leads, or other goals. This way of working keeps performance measurable, the workflow clear, and the user experience sustainable. strong.