I'll show you how to interpret vmstat on Linux effectively: You'll be able to identify CPU bottlenecks, memory pressure, swap, and I/O wait times in just a few seconds. Here’s how to confidently interpret the columns r, b, free, si/so, bi/bo, and us/sy/id/wa/st and use patterns to determine specific actions—without guesswork, using clear Rules.
Key points
- Run Queue vs. Blockages: "r" indicates CPU load; "b" warns of I/O wait times.
- Memory Assess realistically: "free" alone doesn't count; it's the "si/so" that matters.
- I/O In focus: bi/bo are uncritical as long as wa remains low.
- CPU Market Share Meaning: us+sy high, id low → high utilization.
- Baselines Create: Compare everyday values with values during difficult times.

What does vmstat actually show?
Vmstat consolidates process states, memory, swap, block I/O, and CPU usage into a compact output that provides an overview in seconds. system-wide It provides insight. First, I read „procs“ for r/b, then „memory/swap“ for free, buff, cache, and si/so. Next, I check „io“ with bi/bo, and finish with „cpu“ for us, sy, id, wa, and optionally st. This order helps me distinguish between cause and effect: a high r indicates computational load, a high b points to I/O wait times, and a high wa links CPU idle time to I/O latency. This way, I can tell whether computational work, memory scarcity, or storage is the bottleneck—and I save myself Detours.
Start in 60 seconds: Calls and intervals
To get a snapshot since boot, I run „vmstat“ without any parameters; for real-time analysis, I use „vmstat 1“ or „vmstat 5 12“ for twelve data points every five seconds, and I get a temporal Row. Important: The first line shows average values since the system startup, so I focus primarily on the following lines. I use `Delay/Count` to control the sampling rate and duration—for example, „vmstat 1 30“ for short peaks. For erratic workloads, I set it to 1–2 seconds; for quiet scenarios, I tend to use 5 seconds. I look for trends, not individual frames, because patterns reveal the true Causes show.

Understanding Processes: r and b in Everyday Life
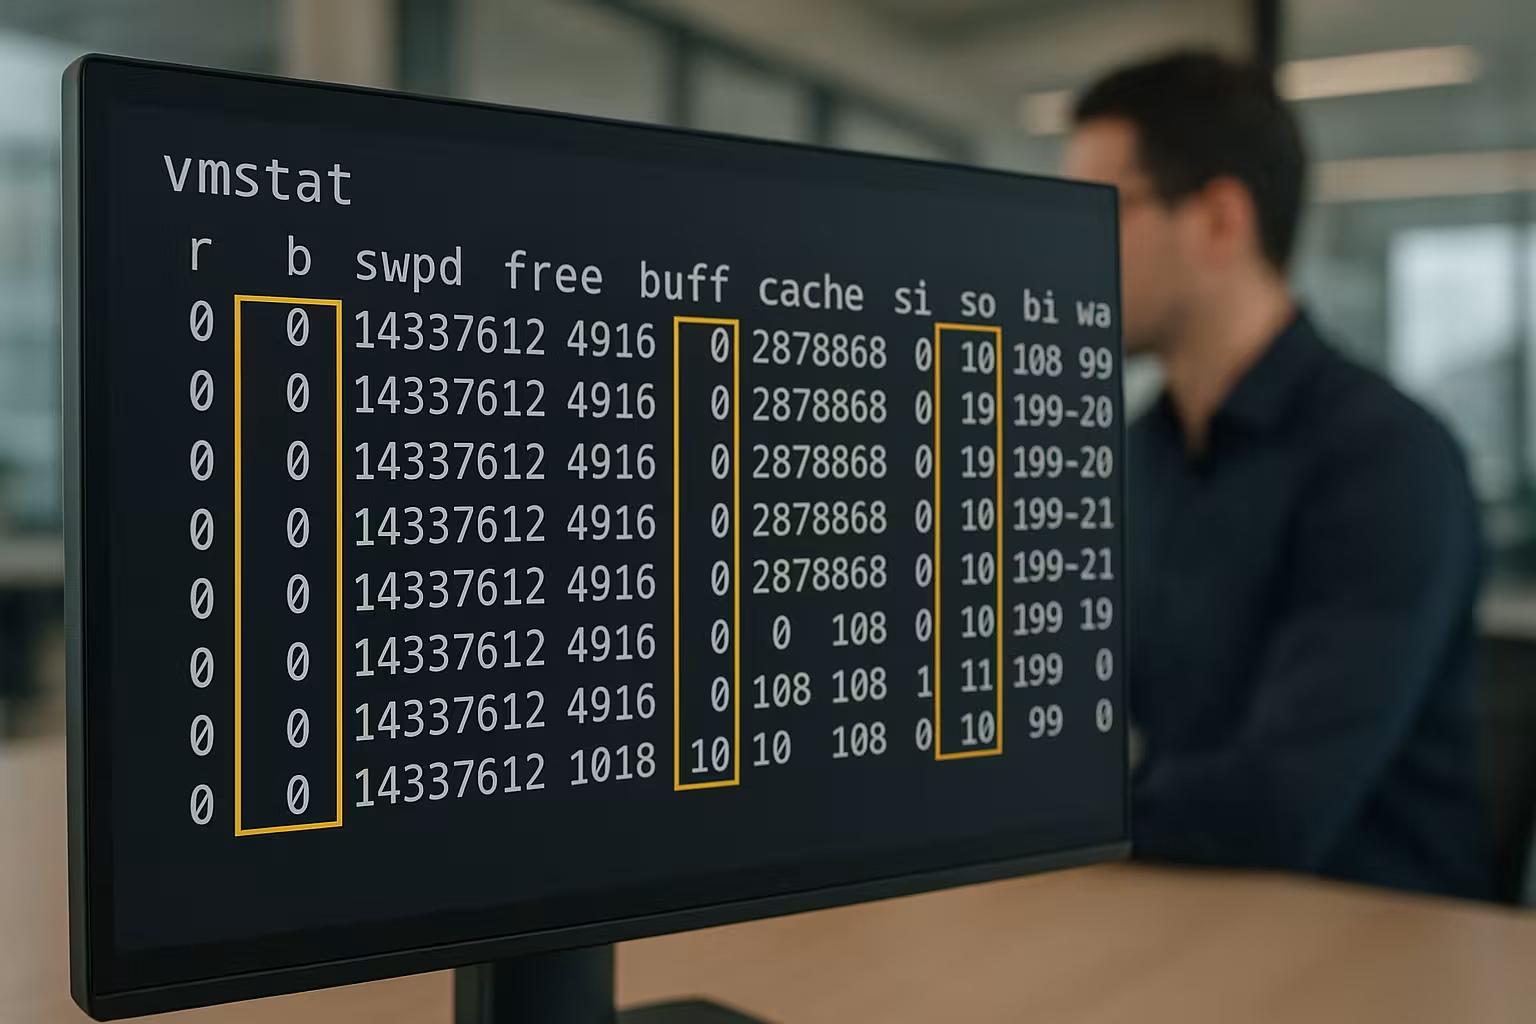
The "r" column shows ready threads waiting for CPU time, while "b" counts blocked threads, often waiting for I/O. If "r" remains significantly higher than the number of physical cores, it suggests that CPU bottleneck On four cores, r=8 over an extended period is considered a clear signal. A b-value greater than 0 over an extended period indicates sluggish storage devices, overloaded databases, or slow network or storage paths. I correlate r with us+sy and id: if id is low and r is high, the CPU is struggling; if wa is high and b is high, I/O is the bottleneck. This is how I decide whether to scale computing power, optimize queries, or Storage system check.
Interpreting memory: free, buff, cache, swpd
A low "free" value is normal on Linux, because the kernel aggressively uses RAM as a cache, which speeds up file accesses and provides real Throughput brings. That’s why I pay more attention to swpd and the si/so swap streams than to free alone. A high cache is good as long as si/so almost always stays at 0; only sustained swap activity indicates real pressure. If latency or even an OOM occurs on top of that, I take action: increase RAM, trim processes in a timely manner, or adjust cache and JVM sizes. Context remains important: workload, memory size, and NUMA layout determine what counts as healthy applies.
Swap Activity: Classify It Either Way
The "si/so" columns measure the constant data flow between RAM and swap in KB/s and reveal actual memory pressure, not just perceived pressure Deficiency. Short spikes are normal, such as when rarely used pages are swapped out. The situation becomes critical when these values remain consistently above 0; this slows everything down, since every swap generates additional I/O overhead. High `so` values indicate active paging, and response times increase painfully. At this point, I address the root causes: reduce memory consumption, expand RAM, or optimize memory-intensive services. tune.
Understanding Block I/O: bi and bo
With bi/bo, I can determine the reading and writing rate in blocks per second, but I don't evaluate it out of context; what matters is how it interacts with wa. High bi/bo values combined with a high wa value indicate that storage can't keep up. If high bi values coincide with a database, I check query profiles and cache hits before replacing hardware. For more in-depth timing analysis, I use iostat to analyze queue lengths and latencies so that I can Analyze I/O Wait and can specifically address bottlenecks. Only when wa remains low but bi/bo skyrockets on a sustained basis will I consider Scaling of the storage system.
CPU shares: us, sy, id, wa, st
High US values with a low WA indicate productive work, while high SY values suggest a significant amount of kernel overhead, such as countless small I/O operations or many Context change. If id is close to 0 and stays there, the CPU is running at its limit; combined with a high r value, this indicates a heavy computational load. If wa increases, the CPU is waiting for I/O—in this case, fine-tuning storage often yields better results than CPU upgrades. In VMs, I pay attention to st (steal): High st values indicate that the hypervisor is diverting CPU time, so I discuss host utilization with the operator. I always evaluate us+sy as a sum, because this shows the active Work in the system.

Quick Reference: Columns and Guidelines
I use the following table as a quick reference when I'm looking at vmstat output for an initial Assessment skimming.
| Column | Meaning | What I pay attention to |
|---|---|---|
| r | Threads Ready to Run | Permanent > Cores → CPU Load |
| b | Blocked Threads | Constant > 0 + wa high → I/O problem |
| free | Free RAM | Low is okay as long as si/so remains ≈ 0 |
| buff/cache | FS Buffer/Page Cache | A lot of cache is good; can be approved become |
| si/so | Swap In/Out | Continuous > 0 → actual storage pressure |
| bi/bo | Block I/O | It's only critical if wa is high at the same time |
| us/sy | User/Kernel | us+sy sustained > 80% → high Load |
| id | idle | Close to 0 over time → CPU saturated |
| wa | I/O wait | High with b high → Storage as the cause |
| st | Steal (VMs) | High → Hypervisor takes CPU-time |
Baselines and Long-Term Monitoring
I don't rely on individual snapshots; instead, I compare the values to baselines from quiet periods so that I can accurately identify outliers recognize. „vmstat 1 60“ gives me a one-minute load profile, which I compare with known normal phases. For historical context, I use sar/sysstat Monitoring, to evaluate trends over several days and refine thresholds. I set alerts conservatively: r relative to cores, si/so not equal to 0 over multiple intervals, wa noticeably elevated. This way, I can respond early, before users report delays and before Peak- Phases escalate.
Vmstat in combination with other tools
I start with vmstat, analyze the patterns, and then dig deeper using iostat, mpstat, pidstat, or application metrics to identify the causes clear Assign. While vmstat displays I/O wait times, I use iostat to measure latencies and queues for each device. If r indicates a kernel limit, mpstat reveals kernel asymmetries. During peak process loads, it provides pidstat Process Analysis the most intense threads about time. Only the correlation with logs and application timings brings the picture into focus and leads me to the real Cause.
Recognize Patterns and Take Action
If I see r as high, id as low, and wa as moderate, the application often optimizes in a way that is computationally intensive, which is why I check the code or parallelism and plan CPU resources before I Hardware I check. If b, wa, and bi/bo are all high, I consider storage tuning, query optimization, and caching. If free is low but si/so is greater than 0, I reduce memory consumption, stream results, or increase RAM. If us is moderate and sy is very high, I look into packet filters, file system options, or drivers. With this checklist, I can act quickly and focus my time where it’s most counts.

Avoiding Measurement Errors: Sampling, Units, First Line
I deliberately do not use the first line to detect acute issues, because it has been averaging the data since boot and completely smooths out peaks. I also base the sampling rate on the hypothesis regarding the cause: I capture CPU spikes at 1-second intervals and slow memory leaks at 5–10-second intervals. I take units into account: si/so are KB/s, bi/bo are „blocks/s“ (historically 1 KB per block, variable depending on the vmstat version). I check whether „vmstat -w“ (wide output) avoids column truncation and whether clock frequency changes (P-states, Turbo) affect short-term load perception. I synchronize measurements with application peaks instead of blindly looking at „whole minutes.“.
Decode the "System" section: in and cs
In addition to procs/memory/swap/io/cpu, vmstat also displays „system“: in (interrupts per second) and cs (Context switches per second). These two values tell me a lot about kernel overhead.
- cs is very high with a moderate workload: thread flutter, worker batches that are too small, or lock contention. I increase batch sizes, adjust parallelism (thread pools), and check for scheduler/mutex hotspots.
- Sudden spikes: network or storage interrupt storms, NAPI/polling effects, or timer interrupts. I compare these with the sy percentage and iostat results to check drivers or network paths.
- cs is proportional to r: This indicates constant pressure to switch contexts due to excessive parallelism. I’ll reduce active parallelism or pin hot threads to specific cores.
I always correlate in/cs with sy and b/wa: Only when considered together does a clear picture emerge as to whether kernel work is useful (e.g., throughput) or merely overhead.
Useful vmstat Variants and Options
I use vmstat flexibly to gain additional insights without having to switch tools:
- vmstat -s: Counter totals (e.g., processes started since boot, major/minor page faults). Ideal for comparing leaks or event counts over time intervals.
- vmstat -m: Slab usage – helps classify kernel caches (dentry/inode, network) as RAM consumers.
- vmstat -d: Disk events at the summary level. Not a substitute for iostat, but good for a quick reality check.
- vmstat -S M: Change the units (M/K) to make the numbers easier to read.
- vmstat -w: Wider columns prevent text from being cut off in long columns of numbers.
I combine these options at short intervals so that I don't miss any events and can still keep track of everything.

Containers, VMs, and cgroups: Special Features
In containers, I interpret vmstat with caution: Much of the kernel data is host-wide, and limits come from Cgroups. High r values in a container reflect the namespace’s perspective, but actual CPU time may be limited by CPU quotas or CPU shares. I base my interpretation on st (Steal) in VMs: A high st value means the hypervisor is stealing time from me—in that case, even perfect app optimization won’t help much as long as the host is overbooked. With memory limits in Cgroups, si/so may fail to trigger even though the container is „struggling“ at the limit (OOM kills instead of swapping). I therefore also check OOM logs and Cgroup statistics and compare vmstat snapshots with the limits.
NUMA and Affinity: When Locality Matters
On NUMA hosts, I check r and us/sy per core (using mpstat) and monitor whether individual sockets are „overheating“ while others are idling. Poor memory locality leads to higher cs/sy and b/wa values due to remote memory accesses. I test CPU and memory affinity (cpuset, numactl), configure large heaps to be „interleaved“ or strictly local, and ensure that hot threads run where their data footprint resides. A stable NUMA layout smooths out cs, reduces wa outliers, and increases the Plannability under load.
Avoiding Misinterpretations: „wa“ and “b” Are More Than Just “Slow Storage Media”
wa doesn't just increase due to traditional disk latencies: NFS/high-latency networks, saturated object storage, blocking cloud volumes, or sluggish page cache writebacks also drive wa up. b counts tasks in uninterruptible sleep (D-state)—this includes hangs in drivers, network paths, or filesystem locks. That’s why I never evaluate wa/b in isolation, but always in conjunction with bi/bo and application timings. If wa is high but bi/bo is low, this often indicates a Waiting Dependency beyond the mere issue of device throughput (e.g., locking, remote I/O, writeback bottlenecks).
Tuning with a Sense of Proportion: Swappiness, Writeback, Scheduler
I don't change Kernel-Tuner until after taking measurements and having a rollback plan in place:
- vm.swappiness: A lower value reduces proactive swapping, which is good for latency-critical apps—but if set too low, it can increase page cache pressure.
- vm.dirty_background_ratio / vm.dirty_ratio (or *_bytes): Affects writeback timing. Values that are too high cause long write bursts (wa spikes); values that are too low increase the frequency of small flushes (sy/bo rise).
- I/O Scheduler/Queue Depth: Different Optima settings for NVMe than for HDD/RAID. I measure latency and throughput trade-offs with iostat before making any changes.
- Network Paths: Many small packets/interrupts flow into /cs/sy. Major tuning controls include GRO/LRO, RPS/RFS, and IRQ affinity—I take measurements before and after.
My goal is to achieve stable, predictable curves in vmstat: us/sy should be more stable, wa/b should be lower, and si/so should be close to 0. Only then do I scale up the hardware.
Playbook: 3-Minute Analysis with vmstat
- 0:00–0:30 – „vmstat 1 30“: Ignore the first line, then check r/b, us/sy/id/wa. Question: CPU limit (r high, id low) or I/O limit (b/wa high)?
- 0:30–1:00 – Tank view: Check swpd and si/so. Is si/so consistently > 0? → Actual tank pressure. Free space is irrelevant.
- 1:00–1:30 – I/O Context: bi/bo vs. wa. High bi/bo without wa? → I/O is bypassed. High wa with moderate bi/bo? → Latency/Lock/Remote I/O.
- 1:30–2:00 – system section: in/cs relative to sy. Is cs very high? → Check for context-switching pressure, parallelism/locking.
- 2:00–3:00 – Refine the hypothesis and select the appropriate tool: iostat for I/O metrics, mpstat for kernel asymmetries, pidstat for process hotspots. Only then proceed to tuning/scaling.
Advanced Examples from Real-World Practice
- CPU saturation without high r: us+sy at 90%+, id ≈ 0, but r is moderate → single-thread hotspot or affinity issue. Solution: Parallelize the hot path; check for core pinning.
- Swap-Thrash: If both are significantly > 0 at the same time, b/wa increases, us decreases → RAM is far too small or the heap is incorrectly sized. Actions: Increase RAM, reduce the working set, adjust swappiness.
- Kernel Overhead: sy high, cs/in high, us moderate → many small system calls/I/O. Remedy: Batching, reducing system calls, checking file system mount options.
- Writeback Backlog: WA high, BO high, short waves → dirty limits too high, storage latency varies. Review writeback tuning and I/O scheduler.
- Pressure to Virtualize: st is visible, r fluctuates, id „jumps“ → Host is sharing the CPU. Solution: Check vCPU allocation/placement; reduce overcommit.
Understanding the Limits of vmstat
Vmstat is an excellent Early-warning sensor, but not a microscope. It shows me that something is causing a bottleneck—and where—but not the specific problematic file, query, or thread. That’s why, after running a vmstat diagnosis, I consistently dive into advanced tools, verify hypotheses from multiple angles, and then change only one thing at a time. This way, improvements remain measurable and reproducible.
Summary from practice
With vmstat, I can tell within seconds whether the CPU, RAM, swap, or I/O is slowing things down by looking at the interaction of r, b, si/so, bi/bo, and us/sy/id/wa/st read. I evaluate trends rather than individual values, compare them to baselines, and, when necessary, consult iostat, mpstat, pidstat, and historical metrics. I ignore the first line in the event of acute disruptions and focus on the subsequent lines with a fixed sampling rate. I make data-driven decisions: r relative to cores, si/so consistently non-zero, wa persistently elevated, us+sy near full utilization. This allows me to quickly derive concrete actions and keep systems running smoothly. reactive.