
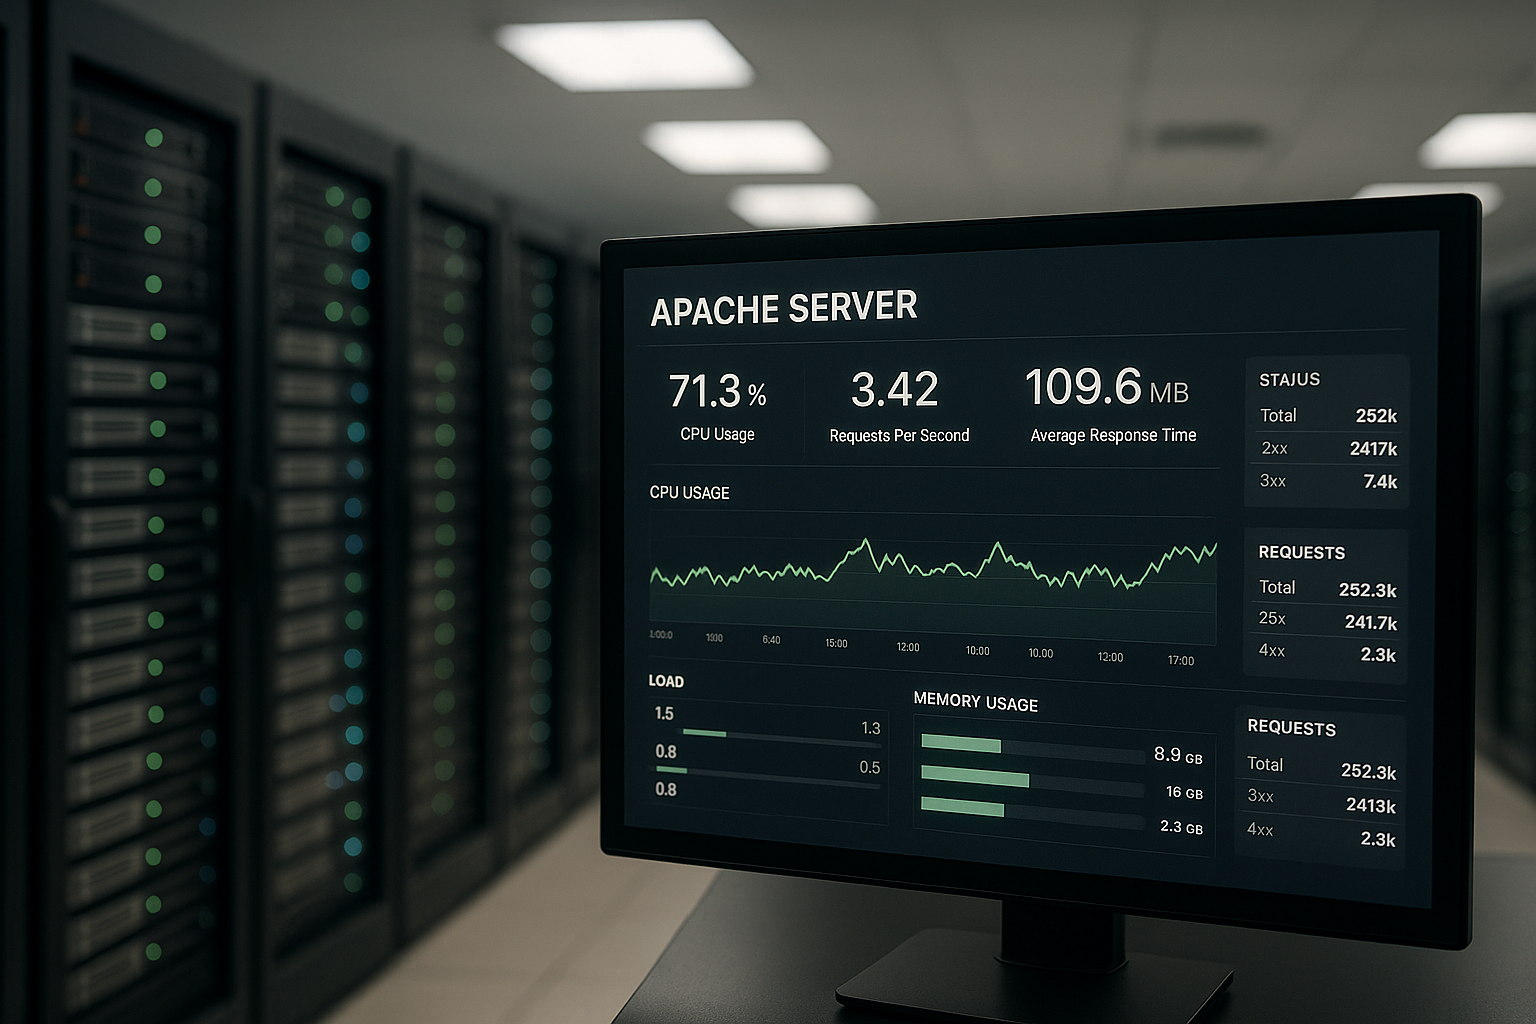
The Apache Scoreboard shows me in real time how many workers are currently reading requests, sending responses, or idling, and I use it to evaluate the Server Utilization No more guesswork. Using mod_status, I access the status data in a structured way, interpret symbols, measure throughput, and derive concrete Tuning Steps from.
Key points
- Real-Time Status understand all workers and quickly identify bottlenecks.
- mod_status Deploy securely and make effective use of ExtendedStatus.
- Key figures systematically analyze metrics such as Req/s, Busy/Idle, and CPU.
- Symbols interpret the scoreboard and take targeted action.
- Monitoring Automate processes and set data-driven alerts.
What is the Apache Scoreboard?
In the scoreboard, Apache stores the current status for each worker—such as Reading, Sending, or Idle—and this allows me to see the Division of Labor of the processes. The data is available internally and is sent to the interface via mod_status, either as HTML or in machine-readable format. There, I check for busy workers, idle workers, CPU load, uptime, as well as requests and bytes. I find the highly granular view of individual workers particularly helpful because it allows me to identify processing times and active hosts. This enables me to make informed decisions about whether capacity is lacking, requests are taking too long, or keep-alive slots are blocked; these Transparency saves time when analyzing the cause.
Here's how I access it using mod_status
Using /server-status, I open a clear, easy-to-read HTML page; using /server-status?auto, I get a concise text output for Monitoring and scripts. In production environments, I enable ExtendedStatus because the additional metrics per worker provide me with the necessary context. I strictly limit access to admin networks or individual hosts and do not make the site publicly accessible. A quick browser session is sufficient for a manual review; for continuous monitoring, I integrate the auto-view into a monitoring system. This way, I keep the overhead low and ensure the status data in a sensible way.
Assessing Secure Configuration and Overhead
I consistently monitor /server-status and decide on a case-by-case basis whether to allow IP access, require authentication, or use an internal admin VHost. ExtendedStatus causes measurable, but in practice minimal, Overhead; I enable it permanently if I'm also using the data in monitoring, or just temporarily for ad hoc analyses. A clear example configuration helps me avoid mistakes:
Enable #
ExtendedStatus On

Make # status available internally only

  SetHandler server-status

  # Option 1: IP-based
  Require ip 10.0.0.0/8 192.168.0.0/16 ::1

  # Option 2: Basic Authentication (e.g., in addition to IP)
  #AuthType Basic
  #AuthName "Server Status"
  #AuthUserFile "/etc/httpd/conf/.htpasswd"
  #Require valid-user
I also make the page available outside the production VHosts (e.g., via an internal address) so that no rewrite rules or proxy routes interfere. When I finish debugging, I verify that only necessary details are published.

How to Quickly Read Scoreboard Icons
When there are malfunctions, I first look at the symbols, because a dense pattern of R and W indicates an acute load, while many _ signal inactivity; these Coding speeds up the diagnosis. K also shows me open keep-alive connections that tie up workers when the timeout is set incorrectly. A focus on D indicates DNS lookups that are delaying responses. Frequent L entries suggest blocking logging and storage subsystems. With just a few glances, I can identify the dominant bottleneck and initiate targeted Measures.
| Symbol | Meaning | Immediate Notice |
|---|---|---|
| _ | Idle Worker | Sufficient Capacity available |
| R | Reading Request | Check network latency or Client |
| W | Sending a Reply | Backend Time and Output Size analyze |
| K | Keep-Alive | Timeouts and Slot Binding check |
| D | DNS Lookup | Disable reverse DNS or cache |
| L | Logging | Asynchronous Logging and I/O check |
| C | Closing | Normal end of connection, short visible |
| G | Graceful finishing | Completed Request, Worker clears at |
| I | Idle cleanup | Uncritical, Worker adjusted |
| . | Idle | Quiet Phase, Resources free |
Detect Advanced Patterns and Attack Profiles
I don't just evaluate individual states, but rather the Duration and distribution of symbols. Many prolonged R states combined with low network bandwidth indicate slow clients or Slowloris patterns; in such cases, I limit read times per request (e.g., using RequestReadTimeout) and set realistic minimum rates. If W states with a high number of bytes per request predominate, bandwidth or storage is more likely to be the limiting factor. Clusters of D and L states occurring simultaneously cause me to prioritize name resolution and log I/O. The decisive factor is whether patterns wide (all workers) or local (only one VHost or path) — that way, I can find hotspots in the application more quickly.
Key Metrics for Web Server Analysis
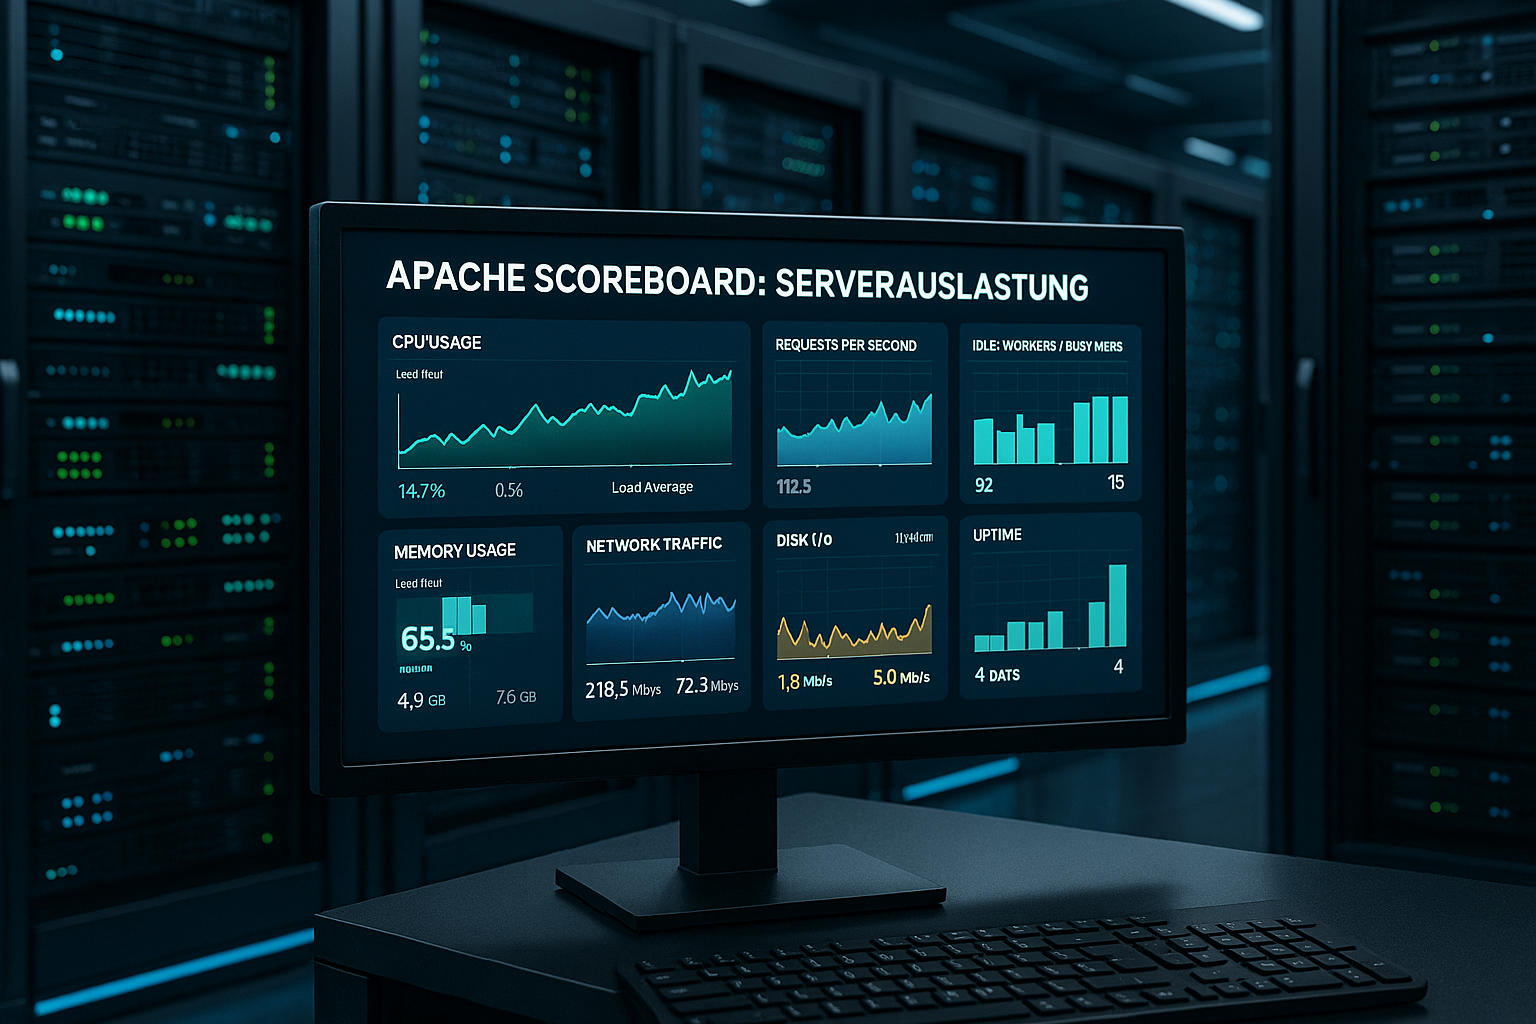
Requests per second show me the throughput, but I also evaluate bytes per second and bytes per request for the payload. The busy-to-idle ratio reveals whether slots are missing or settings are too conservative. I correlate CPU utilization with response times to distinguish between CPU-bound and I/O-bound scenarios. Uptime helps distinguish recent restarts from genuine trends. From this combination, I derive specific tuning levers for workers, keep-alives, and Timeouts from.
Threshold Values and Alarms in Practice
I don't set alerts based on current values, but rather on moving averages, and Duration. The following heuristics, for example, have proven effective: Idle 4:1 over the same period suggests saturation. If Req/s drops while traffic remains constant and Busy stays constant, a backend issue is often the cause. A K-ratio > 50 % during peak hours suggests overly generous keep-alive settings. I’ll supplement the thresholds with trend alerts (rising response times at a constant load) and Seasonality (daily and weekly patterns) so that I can distinguish real changes from normal behavior.
Classify the ScoreboardFile Correctly
On some platforms, Apache writes status data to a scoreboard file, and I place it in a fast, secure directory such as /var/run/httpd; this increases the Reliability. I prevent multiple instances from using the same file, otherwise there is a risk of corrupted values. Some tools read directly from the file, which makes the HTTP endpoint unnecessary. This is beneficial for security hardening and performance, provided the permissions are correct. I document the path and access rights so that maintenance and Monitoring Stay consistent.
Operating System and Container Specifics
I ensure that file descriptor limits, backlogs, and temporary paths are appropriate for the workload. Under systemd, I check whether PrivateTmp or ReadOnlyPaths affect the Scoreboard path. In containers, I estimate memory requirements per process/thread conservatively and set the Scoreboard path to a writable Runtime directory. For peak loads, I adjust the kernel parameters:
# Sample sysctl values (test and document system-wide)
net.core.somaxconn = 4096
net.ipv4.tcp_max_syn_backlog = 4096
fs.file-max = 1048576
I also adjust the `ulimit -n` setting for the Apache service so that it reaches the maximum simultaneity is appropriate (rule of thumb: open FDs ≈ 2–3 × MaxRequestWorkers in proxy-heavy setups). After making changes, I check the scoreboard again to confirm the effects.
Typical use cases: Identifying overworked workers
If almost all slots are occupied by R or W and there are hardly any _ entries, the server runs at its Limit. Then I check MaxRequestWorkers, response times, and blocking backends. If adding more workers doesn’t help, the bottleneck is often in the application, database, or storage. Using `/server-status?auto`, I track performance trends over time rather than just looking at snapshots. This helps me decide whether to adjust settings, improve caching, or Scaling plane.
Resource Model and Capacity Formulas
I calculate capacity in advance to avoid creating memory bottlenecks. For Prefork, the following applies: Memory ≈ number of processes × RSS per process. For Worker/Event: Memory ≈ number of processes × (RSS per process) + threads × thread overhead. I measure the actual RSS using system tools and maintain safety margins. A small example: 20 processes × 50 MB + 500 threads × 1 MB equals ≈ 1.5 GB, plus cache and OS buffers. From this, I derive MaxRequestWorkers, ServerLimit, and ThreadsPerChild. I also take into account that modules such as SSL, PHP, or reverse proxying consume memory per thread can increase; that's why I'm testing under actual load, not just at idle.
Interpreting Queues and Latency
If requests remain in the "Accept" or "Write" state for a long time, perceived latency increases, and I look into queue lengths and the "Accept" backlog; the scoreboard provides valuable Indicators. This post provides me with a more in-depth explanation of queues, latencies, and request handling: Queues and latency. Using these principles, I determine whether bottlenecks occur before, within, or after Apache. I tolerate brief spikes, but I resolve persistent congestion by increasing capacity or adjusting the architecture. This prevents timeouts from escalating and ensures that clients cancel.

Establish a Backend and Proxy Connection
In proxy-heavy environments, I use W-phases to determine whether workers are Upstreams Wait. ExtendedStatus shows me the VHost and the requested resource; I use this to correlate paths with slow backends. I set realistic timeouts (TimeOut, ProxyTimeout) and check connection pooling to ensure threads don’t block unnecessarily. If the pipeline gets congested during uploads, I regulate read rates per client and protect against slow senders. If many large responses are generated, I use compression, chunking, and Caching to consider in order to shorten W-times.
Configure Keep-Alive Specifically
Many K entries indicate clients that leave connections open; this speeds up subsequent requests, but can consume slots bind. I set timeouts so that legitimate repeat requests benefit, while idle traffic isn't blocked for too long. On high-traffic sites, I use an upstream proxy that efficiently bundles keep-alive connections. For details on fine-tuning, I use this guide: Set the Keep-Alive Timeout. With a reasonable timeout, slot binding decreases, and the server remains under load responsive.
HTTP/2, TLS, and MPM Working Together
With HTTP/2, I generally see less K-binding per client because multiple streams use a single connection share. Event-MPM really shines here: Keep-Alive is handled more efficiently, and active work is reserved for threads. TLS increases CPU usage per connection; I monitor whether high W-values correlate with high CPU usage and optimize cipher suites and session resumption. In status views, I determine for each VHost whether HTTP/2 or TLS termination paths dominate and allocate resources accordingly (e.g., more threads instead of more processes when context switches are costly).
DNS Lookups and Logging Under Control
If "D" appears frequently on the scoreboard, I check reverse DNS and either enable a local cache or disable lookups; this reduces the Latency. If I see a lot of L entries, logging slows down processing, so I distribute log files, use faster storage, or employ asynchronous pipelines. I configure rotating logs to avoid flush spikes. At the same time, I monitor write I/O and file locks to break up blocking patterns. This allows me to reclaim processing time and relieve the Worker.

Integration into Monitoring Systems
I periodically collect /server-status?auto, store the values as a time series, and visualize Busy vs. Idle, Req/s, Bytes/s, and CPU load on Dashboards. Alerts define thresholds for consistently full slots, increasing response times, or unusual traffic patterns. I use annotations to flag deployments so I can see the effects immediately. This history helps distinguish one-time spikes from genuine trends. This allows me to manage capacity proactively and prevent Surprises.
Automated Data Collection Using Scripts
For quick checks, a lightweight script that parses the Auto view and outputs only the key metrics is enough for me. I keep the query intervals moderate (e.g., 10–30 seconds) to minimize overhead, and I tag each sample with Host, VHost, and Environment.
#!/bin/sh
URL="http://127.0.0.1/server-status?auto"
curl -s "$URL" | awk -F': ' '
  /BusyWorkers/ {busy=$2}
  /IdleWorkers/ {idle=$2}
  /ReqPerSec/   {rps=$2}
  /BytesPerSec/ {bps=$2}
  END { printf("busy=%s idle=%s rps=%.2f bps=%.0f\n", busy, idle, rps, bps) }
'
In larger environments, I also aggregate by worker times, assign them to VHosts, and calculate Quantile for response times. That way, I can tell whether only some users are experiencing problems or if the majority is affected.
MPM and Capacity Planning
The MPM determines how Apache handles connections; Scoreboard data shows me whether processes or threads are the limiting factor are. For selection and tuning, I compare events and workers, measure idle times, keep-alive bindings, and context switches. This post provides a concise comparison: Event vs. Worker MPM. After making changes, I check the Busy/Idle and Req/s metrics again to verify the effects. This allows me to make data-driven decisions and increase the Efficiency.

Graceful Restart, Rolling Deployments, and Maintenance
When performing deployments or configuration changes, I prefer to trigger a graceful Restart disabled. On the scoreboard, I can tell this is happening by the many G states as new processes start up and old ones shut down gracefully. I plan rolling updates so that enough idle capacity remains: first reduce the load, then perform a graceful reload, and finally handle the remaining nodes. Prolonged G phases are an indication that old processes are waiting for slow requests—in that case, I check timeouts and keep-alives to shorten the switchover time.
Step by Step Toward a Thorough Analysis
I enable mod_status, secure access, and turn on ExtendedStatus so that I can see all Details I get. Then I check the HTML page in the browser and learn the live behavior of the icons. In the next step, I integrate /server-status?auto into my monitoring setup and validate the metrics. Then I optimize the following one by one: number of workers, keep-alive, timeouts, caching, and application paths. I measure each change again until Req/s, response time, and Busy/Idle are back within the Green space lie.
Summary: Apache Scoreboard as a Compass
The Apache Scoreboard gives me a clear, ready-to-use view of utilization, bottlenecks, and the behavior of the Worker. Using mod_status, ExtendedStatus, and robust monitoring, I turn raw data into sound decisions. Metrics and indicators show whether I should scale up capacity, reduce timeouts, or address issues with the application. A small change to Keep-Alive or the MPM can have a big impact if the data is right. Those who read the signs correctly can keep Apache running under load. responsive and plannable.


